Asness, Cliff S., The Siren Song of Factor Timing (April 12, 2016).
Journal of Portfolio Management, Vol. Special Issue, No. 1, 2016.
Available at SSRN: https://ssrn.com/abstract=2763956 or http://dx.doi.org/10.2139/ssrn.2763956
Wednesday, July 24, 2019
Wednesday, July 17, 2019
Size Matters, If You Control Your Junk. Asness, Cliff S. and Frazzini, Andrea and Israel, Ronen and Moskowitz, Tobias J. and Pedersen, Lasse Heje, (January 22, 2015)
Asness, Cliff S. and Frazzini, Andrea and Israel, Ronen and
Moskowitz, Tobias J. and Pedersen, Lasse Heje, Size Matters, If You
Control Your Junk (January 22, 2015). Fama-Miller Working Paper.
Available at SSRN: https://ssrn.com/abstract=2553889 or http://dx.doi.org/10.2139/ssrn.2553889
Abstract
The size premium has been challenged along many fronts: it has a weak historical record, varies significantly over time, in particular weakening after its discovery in the early 1980s, is concentrated among microcap stocks, predominantly resides in January, is not present for measures of size that do not rely on market prices, is weak internationally, and is subsumed by proxies for illiquidity. We find, however, that these challenges are dismantled when controlling for the quality, or the inverse “junk”, of a firm. A significant size premium emerges, which is stable through time, robust to the specification, more consistent across seasons and markets, not concentrated in microcaps, robust to non-price based measures of size, and not captured by an illiquidity premium. Controlling for quality/junk also explains interactions between size and other return characteristics such as value and momentum.Monday, July 15, 2019
Asness, Cliff S. and Brown, Aaron, Pulling the Goalie: Hockey and Investment Implications (March 1, 2018).
Asness, Cliff S. and Brown, Aaron, Pulling the Goalie: Hockey and
Investment Implications (March 1, 2018). Available at SSRN: https://ssrn.com/abstract=3132563 or http://dx.doi.org/10.2139/ssrn.3132563
Abstract
We build a simple, but powerful and intuitive, model for when a hockey coach should pull the goalie when trailing. When the model reports that the coaches aren’t doing it nearly early enough, we then ask why, and take away some key lessons for portfolio and risk management, and business in general.Fact, Fiction, and Value Investing. ASNESS, C., FRAZZINI, A., ISRAEL, R., & MOSKOWITZ, T. (2015)
ASNESS, C., FRAZZINI, A., ISRAEL, R., & MOSKOWITZ, T. (2015). Fact, Fiction, and Value Investing. Journal of Portfolio Management, 42(1), 34–52. https://doi.org/10.3905/jpm.2015.42.1.034
Value investing has been a part of the investment lexicon for the better part of a century, with the diversified systematic value factor (or value effect) studied extensively since at least the 1980s. The authors aim to clarify the many remaining areas of confusion about value investing, focusing on the diversified systematic value strategy, but also exploring how this strategy relates to its more concentrated implementation. They highlight many points about value investing and attempt to prove or disprove each of them, referencing an extensive academic literature and performing simple, yet powerful, tests based on easily accessible, industry-standard public data.
Value investing has been a part of the investment lexicon for the better part of a century, with the diversified systematic value factor (or value effect) studied extensively since at least the 1980s. The authors aim to clarify the many remaining areas of confusion about value investing, focusing on the diversified systematic value strategy, but also exploring how this strategy relates to its more concentrated implementation. They highlight many points about value investing and attempt to prove or disprove each of them, referencing an extensive academic literature and performing simple, yet powerful, tests based on easily accessible, industry-standard public data.
Sunday, July 7, 2019
Portfolio - 07/07/2019
Our current portfolio is composed of 20
stocks, the top 5 of
which are Total SA ADR (TOT), Sanofi SA ADR (SFY), GlaxoSmithKline PLC (GSK), UnitedHealth Group (UNH), and Alphabet Inc Class C (GOOG).
The portfolio is composed 100% of large-cap equities, 41% of which are
classified as Value, 46% Core, and 13% Growth. Energy, Healthcare, and Technology sectors make up 72% of
the
portfolio. Its P/E ratio and P/B ratios are 87% and 86% of the S&P
500’s, respectively, and
its dividend yields 65% more than the S&P 500.
About Sawyer Investment Management Company:
SIMCO
is a Texas-registered Investment Adviser with its principal place of
business in Dallas, Texas. It was formed on January 1, 2015 and is
wholly owned by Ryan Sawyer, who is a CFA Charterholder and a Certified
Public Accountant.
SIMCO specializes in the construction of equity portfolios, and is therefore an ideal resource for long-term investors. The firm goes through a rigorous process for selecting each and every holding in the portfolio. Rooted in the empirical research of academia, the portfolios are generally characterized as large-cap value momentum. For more information about how the portfolios are managed, see our website.
www.sawyerinvestment.com
https://www.facebook.com/SawyerInvestment
https://twitter.com/SawyerInvest
https://sawyerinvestment.blogspot.com/
Friday, June 28, 2019
Value and Momentum Everywhere. Asness, Cliff S. and Moskowitz, Tobias J. and Pedersen, Lasse Heje (June 1, 2012)
This is a summary of a paper written by Cliff Asness, Tobias Moskowitz, and Lasse Pedersen called "Value and Momentum Everywhere", published
in 2012 in Fama-Miller Working Paper. A
video summary can be found at the link below, or a narrative summary
following the video link.
Table 1: Performance of Value and Momentum Portfolios Across Markets and Asset Classes (0:00)
The authors study the period 1972-2011 for US, UK, Europe, and Japan stocks. They rank the stocks in each of the markets by value and momentum characteristics, and form portfolios for the top third, middle third, and low third of stocks according to those rankings. They then calculate the mean returns, standard deviation, sharpe ratio, and alpha figures for each of the three portfolios in each of the 4 markets, including value-only, momentum-only, and 50/50 value/momentum.
They find monotonic increases in excess returns from P1 to P3 for the value, momentum, and combined portfolios; and these excess returns have significant t-statistics. They also find a monotonically increasing and statistically significant sharpe ratio as the value/momentum rankings increase. The major finding, though, is the results when the value and momentum portfolios are combined. In that case, there is still a significant excess return; but with the combined portfolio, the standard deviation is much lower resulting in a significantly higher sharpe ratio than if the value or momentum portfolios were invested alone. This is because the correlation of returns for the value and momentum portfolios are significantly negatively correlated (i.e., a correlation less than -0.60 in most cases).

Next, the authors explored the same value and momentum effects for different asset classes (i.e., country indices, currencies, fixed income, and commodities). They find the same results as those found in the equities discussed above: significant excess returns, sharpe ratios, and alphas (with the exception of fixed income). They also found that by combining value and momentum portfolios, the performance metrics were significantly improved over what they were for value and momentum isolated. The authors also find that when they combine all asset classes in a combined value/momentum portfolio, they achieve a sharpe ratio greater than 1.35, which is higher than any of the asset classes or markets when isolated. This is due to a significantly reduced standard deviation because of diversification effects, while the excess returns remain elevated.

Next, the authors explore some more value and momentum metrics for fixed income, since the metrics they used before (i.e., the 5 year change in yield) did not perform well. They added the real bond yield and the term spread as a metric in the analysis. They find that when using these measures of value, the performance metrics become large and statistically significant; so maybe the value/momentum effect is present in fixed income as well (you just have to use the appropriate measure of value).

Table 2: Correlation of Value and Momentum Strategies Across Markets and Asset Classes (10:33)
Next, the authors analyze the correlations across the markets as well as the asset classes and value vs momentum strategies. They find that the correlations between stock value and momentum strategies are significantly negative; this goes for non-stock value and momentum strategies as well (albeit, less significantly negative). They also find that stock value (momentum) strategies are slightly positively correlated with non-stock value (momentum) strategies. Finally, they look at the correlations of the markets (i.e., US, UK, Japan, and Europe) within value and momentum strategies, and they find those markets to be significantly positively correlated within both stock and non-stock returns.
Next, the authors explore the correlations of stock strategies to non-stock strategies. They find in all cases that the stock value (momentum) strategies are positively correlated with non-stock value (momentum) strategies, and that stock value (momentum) strategies are negatively correlated with non-stock momentum (value) strategies.

Figure 1: First Principal Component for Value and Momentum Strategies (13:50)
Next, the authors explore the first principal components for value and momentum strategies. They find that the first principal components of the momentum strategies are all loaded in the same direction for each of the markets (i.e., US, UK, Europe, and Japan); also, all the first principal components of the value strategies are loaded in the same direction for each of the markets, and in an opposite direction of the momentum strategies (exhibiting a negative correlation between value and momentum strategies in each market).
Next, they perform the same analysis across asset classes (i.e., stocks, countries, currencies, bonds, and commodities), and they find that the first principal components of the momentum strategies are all loaded in the same direction for each asset class; and all the first principal components of the value strategies are loaded in the same direction for each of the asset classes, and in an opposite direction of the momentum strategies (showing the negative correlation between value and momentum strategies in each asset class).
As such, there must be a common global factor structure that produces these results across all asset classes and markets.

Figure 2: Cumulative Returns to Value and Momentum Strategies Across Markets and Asset Classes (15:39)
Next, the authors look at the cumulative returns of value, momentum, and combined strategies across markets and asset classes. They find that in all markets and asset classes, the combined value/momentum strategy outperforms either the value or momentum strategy on its own. They also find the value and momentum returns are significantly negatively correlated, causing a significantly higher sharpe ratio in the combined strategy than in the value or momentum strategies alone.


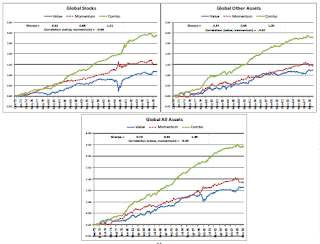
Table 3: Macroeconomic Risk Exposures (16:52)
Next, given the prevalence of the outperformance across markets and asset classes, the authors explore the macroeconomic risk exposures of these strategies to see if there is a common influence on the returns. They find that returns of US value strategies are positively related to long-run consumption growth, term structure, and default risk and negatively related to the market return; returns of US momentum strategies are negatively related to default risk, and unrelated to other macroeconomic factors; returns of global value stocks are positively related to default risk; returns of global momentum stocks are negatively related to default risk; returns of non-stock assets are negatively related to term risk; and returns of non-stock momentum strategies are negatively related to recessions and GDP growth.
As such, default risk seems to be the common source of returns for the value and momentum strategies across asset classes and markets (i.e., returns of value strategies are positively related to default risk and returns of momentum strategies are negatively related to default risk).

Table 4: Liquidity Risk Exposures (19:46)
Next, the authors explore the relationship of value and momentum strategies to liquidity risk measures (in particular, those of funding liquidity and market liquidity). For the US market, they find that returns of value strategies tend to be negatively related to liquidity risk and returns of momentum strategies tend to be positively related to liquidity risk. And in the combined value/momentum strategy, there is no relationship between liquidity risk and the returns of the combined portfolio, suggesting the combined strategy diversifies out the liquidity risk. They find the same results on a global basis as well.


Figure 3: Time Series of Global Liquidity Shocks (21:05)
As a robustness test of the liquidity risk measures, the authors plotted the shocks over the past 25 years, noting they coincide with well-known market shocks.

Figure 4: Liquidity Risk Beta t-statistics (24:41)
Next, the authors look at the t-statistics of the liquidity risk factors within the regression. They find that looking at the individual markets and asset classes individually produce insignificant t-statistics; however, when the asset classes and markets are averaged together, the t-statistics become significant. Had the markets and asset classes not been combined, it might have been found that there is no relationship between liquidity risk and the value and momentum strategies.

Figure 5: Explaining Value and Momentum in One Market with Value and Momentum in Other Markets (25:40)
Next, the authors form regressions for each of the high, low, medium portfolios across each market and each asset class. Then using those regressions, they calculate an expected return and compare that to the actual return for each portfolio. They find that a regression with just the market, value, and momentum factors (the AMP 3-factor model) on a global basis do a reasonable job of predicting actual returns, with an R^2 of 0.55 and a very small alpha.

Figure 6: Asset Pricing Tests of the Cross Section of Expected Returns (28:31)
Next, the authors perform this same regression using other common asset pricing models, such as the CAPM and the Fama-French 4-factor and 6-factor models. They find their AMP 3-factor model (at an R^2 of 0.71) does a better job at predicting the actual returns to the portfolios than do the other common pricing models. They also perform this for US assets only, using the global factor loadings; they find that the Fama-French 4-factor and 6-factor models do a better job at predicting the portfolio returns than does the AMP 3-factor model, but this is because the AMP model is using global data to form the regression, while the Fama-French models are using US data to form the regressions. It makes sense that US data does better at predicting US returns; however, the authors want to emphasize how well the global data in the AMP model predicts returns of US assets, further exhibiting the interconnectedness of the markets and factors.
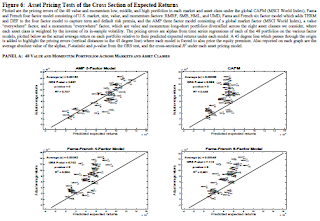
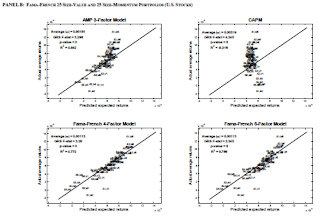
Table 5: Cross-Sectional Asset Pricing Tests of Global Value and Momentum Strategies (31:58)
Next, the authors want to see how various economic indicators explain the returns of each of the 48 portfolios in this study. They find that liquidity risk is significantly positively related to the returns of the portfolios when regressed along, and term risk and default risk are also significantly related; however, when those risk measures are combined in a regression, the liquidity risk subsumes the term and default risk; and further, when value and momentum factors are included in the regression, the liquidity risk is subsumed by those factors. As such, the value and momentum premiums may be capturing liquidity risk.
Next, the authors explore funding and market liquidity separately, and they find that the funding liquidity is the factor that has the most influence on the returns (and not necessarily market liquidity); in both cases, however, the value and momentum factors subsume the liquidity risk measure.

Table 6: Time Series Asset Pricing Tests of Global Value and Momentum Strategies (34:42)
Next, the authors explore the regressions of several asset pricing models (i.e., the CAPM, Fama-French models, macroeconomic models, and APM 3-factor model). They find the APM 3-factor model best explains the cross-section of returns (i.e., it has the highest R^2, the lowest alpha, and the lowest F-stat). This means that a regression with the global zero-cost value, zero-cost momentum, and market factor do a good job of explaining the returns to these portfolios.
Next, they use the Fama-French 25 value / 25 momentum portfolios for forming the regression. As we saw in a previous table, the Fama-French 6-factor model does a better job of explaining the US returns because it uses US data in forming the regression; but the AMP 3-factor model (global market, value and momentum) still does a good job of explaining the returns.
Next, the authors explore how well the models can explain hedge fund returns (given the increased use by hedge funds in using factor-based portfolios). They find the AMP 3-factor model does the best at explaining the hedge-fund returns.


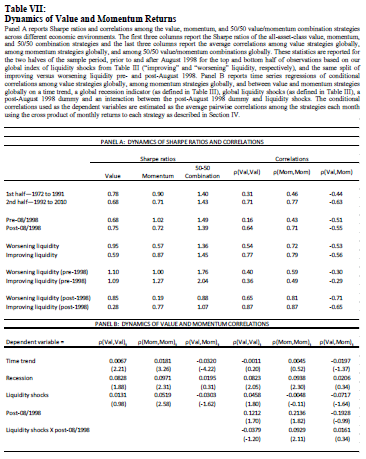
Table 7: Dynamics of Value and Momentum Returns (40:07)
Finally, given the success of these value and momentum strategies, the authors look at the performance of the strategies over different time periods ('72-'91 and '92-'10). They find that the returns and sharpe ratios of the value and momentum strategies have decreased in the more recent period than the former period; however, the returns of the combined momentum/value strategy has remained constant across both periods. The correlations within the value and momentum strategies have significantly increased from the prior period to the more recent period; however, the correlations between value and momentum strategies have become more negative.
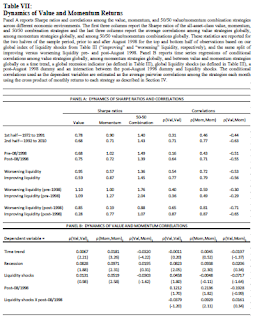
Table 1: Performance of Value and Momentum Portfolios Across Markets and Asset Classes (0:00)
The authors study the period 1972-2011 for US, UK, Europe, and Japan stocks. They rank the stocks in each of the markets by value and momentum characteristics, and form portfolios for the top third, middle third, and low third of stocks according to those rankings. They then calculate the mean returns, standard deviation, sharpe ratio, and alpha figures for each of the three portfolios in each of the 4 markets, including value-only, momentum-only, and 50/50 value/momentum.
They find monotonic increases in excess returns from P1 to P3 for the value, momentum, and combined portfolios; and these excess returns have significant t-statistics. They also find a monotonically increasing and statistically significant sharpe ratio as the value/momentum rankings increase. The major finding, though, is the results when the value and momentum portfolios are combined. In that case, there is still a significant excess return; but with the combined portfolio, the standard deviation is much lower resulting in a significantly higher sharpe ratio than if the value or momentum portfolios were invested alone. This is because the correlation of returns for the value and momentum portfolios are significantly negatively correlated (i.e., a correlation less than -0.60 in most cases).

Next, the authors explored the same value and momentum effects for different asset classes (i.e., country indices, currencies, fixed income, and commodities). They find the same results as those found in the equities discussed above: significant excess returns, sharpe ratios, and alphas (with the exception of fixed income). They also found that by combining value and momentum portfolios, the performance metrics were significantly improved over what they were for value and momentum isolated. The authors also find that when they combine all asset classes in a combined value/momentum portfolio, they achieve a sharpe ratio greater than 1.35, which is higher than any of the asset classes or markets when isolated. This is due to a significantly reduced standard deviation because of diversification effects, while the excess returns remain elevated.

Next, the authors explore some more value and momentum metrics for fixed income, since the metrics they used before (i.e., the 5 year change in yield) did not perform well. They added the real bond yield and the term spread as a metric in the analysis. They find that when using these measures of value, the performance metrics become large and statistically significant; so maybe the value/momentum effect is present in fixed income as well (you just have to use the appropriate measure of value).

Table 2: Correlation of Value and Momentum Strategies Across Markets and Asset Classes (10:33)
Next, the authors analyze the correlations across the markets as well as the asset classes and value vs momentum strategies. They find that the correlations between stock value and momentum strategies are significantly negative; this goes for non-stock value and momentum strategies as well (albeit, less significantly negative). They also find that stock value (momentum) strategies are slightly positively correlated with non-stock value (momentum) strategies. Finally, they look at the correlations of the markets (i.e., US, UK, Japan, and Europe) within value and momentum strategies, and they find those markets to be significantly positively correlated within both stock and non-stock returns.
Next, the authors explore the correlations of stock strategies to non-stock strategies. They find in all cases that the stock value (momentum) strategies are positively correlated with non-stock value (momentum) strategies, and that stock value (momentum) strategies are negatively correlated with non-stock momentum (value) strategies.

Figure 1: First Principal Component for Value and Momentum Strategies (13:50)
Next, the authors explore the first principal components for value and momentum strategies. They find that the first principal components of the momentum strategies are all loaded in the same direction for each of the markets (i.e., US, UK, Europe, and Japan); also, all the first principal components of the value strategies are loaded in the same direction for each of the markets, and in an opposite direction of the momentum strategies (exhibiting a negative correlation between value and momentum strategies in each market).
Next, they perform the same analysis across asset classes (i.e., stocks, countries, currencies, bonds, and commodities), and they find that the first principal components of the momentum strategies are all loaded in the same direction for each asset class; and all the first principal components of the value strategies are loaded in the same direction for each of the asset classes, and in an opposite direction of the momentum strategies (showing the negative correlation between value and momentum strategies in each asset class).
As such, there must be a common global factor structure that produces these results across all asset classes and markets.

Figure 2: Cumulative Returns to Value and Momentum Strategies Across Markets and Asset Classes (15:39)
Next, the authors look at the cumulative returns of value, momentum, and combined strategies across markets and asset classes. They find that in all markets and asset classes, the combined value/momentum strategy outperforms either the value or momentum strategy on its own. They also find the value and momentum returns are significantly negatively correlated, causing a significantly higher sharpe ratio in the combined strategy than in the value or momentum strategies alone.


Table 3: Macroeconomic Risk Exposures (16:52)
Next, given the prevalence of the outperformance across markets and asset classes, the authors explore the macroeconomic risk exposures of these strategies to see if there is a common influence on the returns. They find that returns of US value strategies are positively related to long-run consumption growth, term structure, and default risk and negatively related to the market return; returns of US momentum strategies are negatively related to default risk, and unrelated to other macroeconomic factors; returns of global value stocks are positively related to default risk; returns of global momentum stocks are negatively related to default risk; returns of non-stock assets are negatively related to term risk; and returns of non-stock momentum strategies are negatively related to recessions and GDP growth.
As such, default risk seems to be the common source of returns for the value and momentum strategies across asset classes and markets (i.e., returns of value strategies are positively related to default risk and returns of momentum strategies are negatively related to default risk).

Table 4: Liquidity Risk Exposures (19:46)
Next, the authors explore the relationship of value and momentum strategies to liquidity risk measures (in particular, those of funding liquidity and market liquidity). For the US market, they find that returns of value strategies tend to be negatively related to liquidity risk and returns of momentum strategies tend to be positively related to liquidity risk. And in the combined value/momentum strategy, there is no relationship between liquidity risk and the returns of the combined portfolio, suggesting the combined strategy diversifies out the liquidity risk. They find the same results on a global basis as well.


Figure 3: Time Series of Global Liquidity Shocks (21:05)
As a robustness test of the liquidity risk measures, the authors plotted the shocks over the past 25 years, noting they coincide with well-known market shocks.

Figure 4: Liquidity Risk Beta t-statistics (24:41)
Next, the authors look at the t-statistics of the liquidity risk factors within the regression. They find that looking at the individual markets and asset classes individually produce insignificant t-statistics; however, when the asset classes and markets are averaged together, the t-statistics become significant. Had the markets and asset classes not been combined, it might have been found that there is no relationship between liquidity risk and the value and momentum strategies.

Figure 5: Explaining Value and Momentum in One Market with Value and Momentum in Other Markets (25:40)
Next, the authors form regressions for each of the high, low, medium portfolios across each market and each asset class. Then using those regressions, they calculate an expected return and compare that to the actual return for each portfolio. They find that a regression with just the market, value, and momentum factors (the AMP 3-factor model) on a global basis do a reasonable job of predicting actual returns, with an R^2 of 0.55 and a very small alpha.

Figure 6: Asset Pricing Tests of the Cross Section of Expected Returns (28:31)
Next, the authors perform this same regression using other common asset pricing models, such as the CAPM and the Fama-French 4-factor and 6-factor models. They find their AMP 3-factor model (at an R^2 of 0.71) does a better job at predicting the actual returns to the portfolios than do the other common pricing models. They also perform this for US assets only, using the global factor loadings; they find that the Fama-French 4-factor and 6-factor models do a better job at predicting the portfolio returns than does the AMP 3-factor model, but this is because the AMP model is using global data to form the regression, while the Fama-French models are using US data to form the regressions. It makes sense that US data does better at predicting US returns; however, the authors want to emphasize how well the global data in the AMP model predicts returns of US assets, further exhibiting the interconnectedness of the markets and factors.
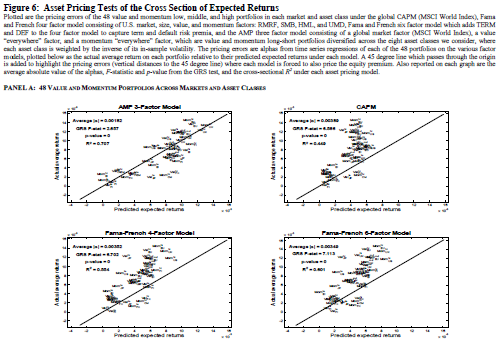

Table 5: Cross-Sectional Asset Pricing Tests of Global Value and Momentum Strategies (31:58)
Next, the authors want to see how various economic indicators explain the returns of each of the 48 portfolios in this study. They find that liquidity risk is significantly positively related to the returns of the portfolios when regressed along, and term risk and default risk are also significantly related; however, when those risk measures are combined in a regression, the liquidity risk subsumes the term and default risk; and further, when value and momentum factors are included in the regression, the liquidity risk is subsumed by those factors. As such, the value and momentum premiums may be capturing liquidity risk.
Next, the authors explore funding and market liquidity separately, and they find that the funding liquidity is the factor that has the most influence on the returns (and not necessarily market liquidity); in both cases, however, the value and momentum factors subsume the liquidity risk measure.

Table 6: Time Series Asset Pricing Tests of Global Value and Momentum Strategies (34:42)
Next, the authors explore the regressions of several asset pricing models (i.e., the CAPM, Fama-French models, macroeconomic models, and APM 3-factor model). They find the APM 3-factor model best explains the cross-section of returns (i.e., it has the highest R^2, the lowest alpha, and the lowest F-stat). This means that a regression with the global zero-cost value, zero-cost momentum, and market factor do a good job of explaining the returns to these portfolios.
Next, they use the Fama-French 25 value / 25 momentum portfolios for forming the regression. As we saw in a previous table, the Fama-French 6-factor model does a better job of explaining the US returns because it uses US data in forming the regression; but the AMP 3-factor model (global market, value and momentum) still does a good job of explaining the returns.
Next, the authors explore how well the models can explain hedge fund returns (given the increased use by hedge funds in using factor-based portfolios). They find the AMP 3-factor model does the best at explaining the hedge-fund returns.


Table 7: Dynamics of Value and Momentum Returns (40:07)
Abstract
We study the returns to value and momentum strategies jointly across eight diverse markets and asset classes. Finding consistent value and momentum premia in every asset class, we further find strong common factor structure among their returns. Value and momentum are more positively correlated across asset classes than passive exposures to the asset classes themselves. However, value and momentum are negatively correlated both within and across asset classes. Our results indicate the presence of common global risks that we characterize with a three factor model. Global funding liquidity risk is a partial source of these patterns, which are identifiable only when examining value and momentum simultaneously across markets. Our findings present a challenge to existing behavioral, institutional, and rational asset pricing theories that largely focus on U.S. equities.
Suggested Citation:
Asness, Cliff S. and Moskowitz, Tobias J. and Pedersen, Lasse
Heje, Value and Momentum Everywhere (June 1, 2012). Chicago Booth
Research Paper No. 12-53; Fama-Miller Working Paper. Available at SSRN: https://ssrn.com/abstract=2174501 or http://dx.doi.org/10.2139/ssrn.2174501
Sunday, June 16, 2019
The 52-week high, momentum, and predicting mutual fund returns. Sapp, T. (2011)
This is a summary of a paper written by Travis R.A. Sapp called "The 52-week high, momentum, and predicting mutual fund returns", published in 2011 in the Review of Quantitative Finance and Accounting journal. A video summary can be found at the link below, or a narrative summary following the video link.
Table 1. Sample descriptive statistics
The authors are going to examine the results of using three different methods of momentum for mutual fund portfolios over the period 1970 - 2004: ranking by past 6 month returns (JT), momentum factor loading (Beta4), and nearness to the 52-week high (52-week).

Table 2. Profits from momentum strategies: top and bottom 10%
The authors first rank the 3 methods using the top and bottom deciles, showing the long, short, and zero-cost returns. They find that the JT and 52-week strategies provide significant excess returns; however, the Beta4 strategy's excess returns are not statistically different than zero. The authors also analyzed these returns on a risk-basis, by putting the returns into the Fama-French 3-factor model and determining the alphas. They find all three strategies have significant alphas.

Table 3. Profits from momentum strategies: top and bottom 30%
Next, the authors perform the same analysis; but they rank the 3 methods with the top and bottom 30% of mutual funds (rather than the 10% in table 2). They find the same conclusion noted in table 2; although, the excess returns are a bit dampened now that the less extreme cases are included.

Figure 1. One-Month Raw Returns
Next, the authors summarize graphically the returns of the 10% zero-cost portfolio and the 30% zero-cost portfolio over a 12-month period for each of the three ranking strategies. It is clear that the JT and 52-week strategy have initial significant excess returns; however, those excess returns dissipate by the 12th month. The Beta4 strategy has initially low excess returns; but those returns are consistent throughout the 12 months and end the year with the highest of the three strategies.

Figure 2. One-Month Alphas
Next, the authors summarize graphically the alphas of the 10% zero-cost portfolio and the 30% zero-cost portfolio over a 12-month period for each of the three ranking strategies. Again we see the JT and 52-week strategy have initial significant excess returns; however, those excess returns dissipate by the 12th month, and the Beta4 strategy overtakes them.

Table 4. Comparison of momentum trading strategies
Next, the authors perform a Fama-MacBeth analysis of the three ranking strategies for the 10% and 30% zero-cost portfolios. They find the same results as tables 1 and 2; whereby the JT and 52-week strategies provide significant excess raw returns; however, the beta4 strategy lags. But all three strategies have statistically significant alphas over 3, 6, and 12 month time periods.

Figure 3. One-Month Hedged Alphas
Next, the authors take the results from table 4 and summarize them graphically over a 12 month period. As was found in the prior figures, we see the JT and 52-week strategy have initial significant excess returns; however, those excess returns dissipate by the 12th month, and the Beta4 strategy overtakes them.

Figure 4. Long-Term One-Month Alphas
Next, the authors decided to extend their period of analysis out to a 24-month holding period. They find that in the 13 to 24 month period, the JT and 52-week strategies continue to perform close to 0 hedged alphas, and the Beta4 strategy continues to outperform (although its hedged alpha slowly decreases over time). As such, a long-term investor might prefer using the Beta4 strategy to capture more consistent excess returns than the JT and 52-week strategies (whose excess returns seem to be short-term and fleeting.

Table 5-7. Comparison of momentum strategies: no-load funds
Next, the authors isolate the no-load funds within their population, as a way to explore whether the three strategies can be profitable on a practical trading basis. They explore the raw and risk-adjusted returns on the top/bottom deciles [Table 5], raw and risk-adjusted returns on the top/bottom 30% [Table 6], and hedged alphas on the top/bottom deciles and 30% [Table 7]. They find the same results as they found across all funds; therefore, these strategies could be implemented efficiently.


Table 8. Determinants of fund cash flows
Finally, the authors explore whether any of these three ranking strategies explain the cash flows into and out of a fund. They find that the JT and 52-week strategies significantly explain cash flows into a fund, but the Beta4 strategy does not. Other significant explanatory factors include total net assets, previous month's net cash flow, and expense ratio.

Sapp, T. (2011). The 52-week high, momentum, and predicting mutual fund returns. Review of Quantitative Finance & Accounting, 37(2), 149–179.
https://doi.org/10.1007/s11156-010-0199-7
George and Hwang (J Finance 59:2145-2176, ) have shown that the 52-week high share price carries significant predictive ability for individual stock returns, dominating other common momentum-based trading strategies. Based upon their results and other methods, this paper examines and compares the performance of three momentum trading strategies for mutual funds, including an analogous 1-year high measure for the net asset value of mutual fund shares. Strategies based on prior extreme returns and on fund exposure to stock return momentum are also examined. Results show that all three measures have significant, independent, predictive ability for fund returns. Further, each produces a distinctive pattern in momentum profits, whether measured in raw or risk-adjusted returns, with profits from momentum loading being the least transitory. Nearness to the 1-year high and recent extreme returns are significant predictors of fund monthly cash flows, whereas fund momentum loading is not.
The authors are going to examine the results of using three different methods of momentum for mutual fund portfolios over the period 1970 - 2004: ranking by past 6 month returns (JT), momentum factor loading (Beta4), and nearness to the 52-week high (52-week).

Table 2. Profits from momentum strategies: top and bottom 10%
The authors first rank the 3 methods using the top and bottom deciles, showing the long, short, and zero-cost returns. They find that the JT and 52-week strategies provide significant excess returns; however, the Beta4 strategy's excess returns are not statistically different than zero. The authors also analyzed these returns on a risk-basis, by putting the returns into the Fama-French 3-factor model and determining the alphas. They find all three strategies have significant alphas.
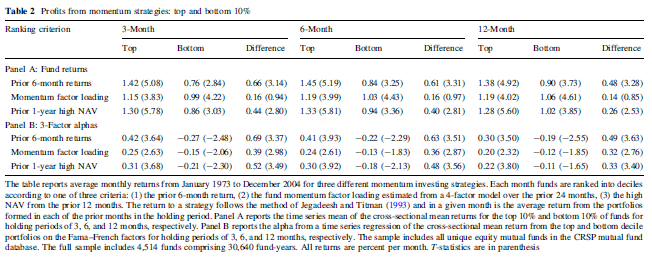
Table 3. Profits from momentum strategies: top and bottom 30%
Next, the authors perform the same analysis; but they rank the 3 methods with the top and bottom 30% of mutual funds (rather than the 10% in table 2). They find the same conclusion noted in table 2; although, the excess returns are a bit dampened now that the less extreme cases are included.

Figure 1. One-Month Raw Returns
Next, the authors summarize graphically the returns of the 10% zero-cost portfolio and the 30% zero-cost portfolio over a 12-month period for each of the three ranking strategies. It is clear that the JT and 52-week strategy have initial significant excess returns; however, those excess returns dissipate by the 12th month. The Beta4 strategy has initially low excess returns; but those returns are consistent throughout the 12 months and end the year with the highest of the three strategies.

Figure 2. One-Month Alphas
Next, the authors summarize graphically the alphas of the 10% zero-cost portfolio and the 30% zero-cost portfolio over a 12-month period for each of the three ranking strategies. Again we see the JT and 52-week strategy have initial significant excess returns; however, those excess returns dissipate by the 12th month, and the Beta4 strategy overtakes them.

Table 4. Comparison of momentum trading strategies
Next, the authors perform a Fama-MacBeth analysis of the three ranking strategies for the 10% and 30% zero-cost portfolios. They find the same results as tables 1 and 2; whereby the JT and 52-week strategies provide significant excess raw returns; however, the beta4 strategy lags. But all three strategies have statistically significant alphas over 3, 6, and 12 month time periods.

Figure 3. One-Month Hedged Alphas
Next, the authors take the results from table 4 and summarize them graphically over a 12 month period. As was found in the prior figures, we see the JT and 52-week strategy have initial significant excess returns; however, those excess returns dissipate by the 12th month, and the Beta4 strategy overtakes them.

Figure 4. Long-Term One-Month Alphas
Next, the authors decided to extend their period of analysis out to a 24-month holding period. They find that in the 13 to 24 month period, the JT and 52-week strategies continue to perform close to 0 hedged alphas, and the Beta4 strategy continues to outperform (although its hedged alpha slowly decreases over time). As such, a long-term investor might prefer using the Beta4 strategy to capture more consistent excess returns than the JT and 52-week strategies (whose excess returns seem to be short-term and fleeting.

Table 5-7. Comparison of momentum strategies: no-load funds
Next, the authors isolate the no-load funds within their population, as a way to explore whether the three strategies can be profitable on a practical trading basis. They explore the raw and risk-adjusted returns on the top/bottom deciles [Table 5], raw and risk-adjusted returns on the top/bottom 30% [Table 6], and hedged alphas on the top/bottom deciles and 30% [Table 7]. They find the same results as they found across all funds; therefore, these strategies could be implemented efficiently.


Table 8. Determinants of fund cash flows
Finally, the authors explore whether any of these three ranking strategies explain the cash flows into and out of a fund. They find that the JT and 52-week strategies significantly explain cash flows into a fund, but the Beta4 strategy does not. Other significant explanatory factors include total net assets, previous month's net cash flow, and expense ratio.

Sapp, T. (2011). The 52-week high, momentum, and predicting mutual fund returns. Review of Quantitative Finance & Accounting, 37(2), 149–179.
https://doi.org/10.1007/s11156-010-0199-7
George and Hwang (J Finance 59:2145-2176, ) have shown that the 52-week high share price carries significant predictive ability for individual stock returns, dominating other common momentum-based trading strategies. Based upon their results and other methods, this paper examines and compares the performance of three momentum trading strategies for mutual funds, including an analogous 1-year high measure for the net asset value of mutual fund shares. Strategies based on prior extreme returns and on fund exposure to stock return momentum are also examined. Results show that all three measures have significant, independent, predictive ability for fund returns. Further, each produces a distinctive pattern in momentum profits, whether measured in raw or risk-adjusted returns, with profits from momentum loading being the least transitory. Nearness to the 1-year high and recent extreme returns are significant predictors of fund monthly cash flows, whereas fund momentum loading is not.
Tuesday, April 16, 2019
On style momentum strategies. Aarts, F., & Lehnert, T. (2005)
The authors want to understand the momentum of various styles (e.g., the size or value factor) in securities' returns; for example, these styles have outperformed in some time periods and underperformed in other time periods; so is there a persistence in the returns to these styles over time, and would it be a good investment strategy to buy into the styles that have performed well in the recent past?
To do so, the authors split the stocks of the FTSE 350 into the 9 Morningstar style boxes (i.e., 3 size boxes times 3 value/growth boxes), then explore the returns to portfolios that go long the recent highest performing style and short the recent lowest performing style over various formation and holding periods. In doing so, they find the only time periods where the strategy has statistically significant returns is for the 3/3 formation/holding period and the 6/9 formation/holding period, and the excess returns were in the 0.58% to 0.78% range.
Next, the authors formed price momentum portfolios by going long the recent highest performing decile of stocks and going short the recent lowest performing decile of stocks. They find that the only formation/holding periods with statistically significant excess returns are the 3/9 and 6/9 formation/holding periods, and the excess returns were in the 0.67% to 1.60% range.
Aarts, F., & Lehnert, T. (2005). On style momentum strategies. Applied Economics Letters, 12(13), 795–799.
https://doi.org/10.1080/13504850500373602
Barberis and Shleifer (2003) suggest that US investors classify assets into different styles based on, for example, market capitalization or B/M ratios. They find that prices can deviate substantially from fundamental values as a style's popularity changes over time. In this paper, we discuss implications of this prediction and empirically investigate the profitability of style momentum strategies for the UK stock market. Results suggest that a simple trading rule can generate significant positive returns, but for our sample of FTSE 350 stocks those strategies are less profitable and more risky compared to regular momentum strategies.
To do so, the authors split the stocks of the FTSE 350 into the 9 Morningstar style boxes (i.e., 3 size boxes times 3 value/growth boxes), then explore the returns to portfolios that go long the recent highest performing style and short the recent lowest performing style over various formation and holding periods. In doing so, they find the only time periods where the strategy has statistically significant returns is for the 3/3 formation/holding period and the 6/9 formation/holding period, and the excess returns were in the 0.58% to 0.78% range.
Next, the authors formed price momentum portfolios by going long the recent highest performing decile of stocks and going short the recent lowest performing decile of stocks. They find that the only formation/holding periods with statistically significant excess returns are the 3/9 and 6/9 formation/holding periods, and the excess returns were in the 0.67% to 1.60% range.
https://doi.org/10.1080/13504850500373602
Barberis and Shleifer (2003) suggest that US investors classify assets into different styles based on, for example, market capitalization or B/M ratios. They find that prices can deviate substantially from fundamental values as a style's popularity changes over time. In this paper, we discuss implications of this prediction and empirically investigate the profitability of style momentum strategies for the UK stock market. Results suggest that a simple trading rule can generate significant positive returns, but for our sample of FTSE 350 stocks those strategies are less profitable and more risky compared to regular momentum strategies.
Sunday, April 14, 2019
European Price Momentum and Analyst Behavior. van Dijk, R., & Huibers, F. (2002)
The authors are studying price momentum across several European countries over the period 1987 - 1999. Specifically they want to analyze the prevalence of earnings surprises, which would suggest the cause of momentum returns to be the underreaction to information, as has been previously studied.
They formed their porfolios similarly to prior researchers and ranked the portfolios into deciles of past returns, for 1/3/6/12 month holding periods. They find a monotonic increase in returns in all formation periods. Also, they provide risk-adjusted returns (i.e., controlled for size, value, market, and country risk), which show a monotonic increase in alpha as the past returns increase; however, the alpha is only positive in the top 3-4 deciles.
Next, the authors explore the relationship between momentum returns, and those attributable to the value, size, and earnings growth factors. They hope to determine whether momentum returns are in fact just returns to value, size or earnings growth expectations. Regarding the value factor, they find that the momentum returns and the value returns are negatively related; the momentum returns are negatively related to the market cap; and the expected earnings growth is not related to momentum. Therefore, they find momentum is effective on a stand-alone basis and is not supplanted by other factors.
Next, the authors look at earnings surprises for each of the deciles of momentum portfolios. They find that as the past returns increase, so do the earnings surprises. The authors suggest that analysts tend to be too pessimistic in their forecasts of past winner portfolios and too optimistic in their forecasts of past loser portfolios. They also find that the higher momentum portfolios also tend to have higher earnings forecast revisions than do the lower momentum portfolios. Finally, the higher momentum portfolios tend to have a higher percentage of positive earnings forecast revisions than do lower momentum portfolios.
van Dijk, R., & Huibers, F. (2002). European Price Momentum and Analyst Behavior. Financial Analysts Journal, 58(2), 96.
https://doi.org/10.2469/faj.v58.n2.2526
Previous studies have found evidence that selecting stocks with positive price momentum is effective in the U.S., European, and emerging stock markets periods up to a year. The reasons that historical price momentum forecasts the direction and magnitude of stock returns, however, are not clear. Insight into the determinants of price momentum would allow investors to judge whether and how price momentum should play a role in their investment strategies. Studying the European stock markets, we found that positive price momentum is caused by analyst underreaction to new earnings information. We found earnings surprises, expected earnings growth, and earnings revisions to be systematically related to historical price movements. Importantly, the data show that European price momentum is distinct from the widely documented value and size effects. Our findings clarify the benefits of assessing analyst behavior to predict whether momentum investing might work in the next period.
Thursday, April 11, 2019
Capital Investment and Momentum Strategies. Jiang, G., Li, D., & Li, G. (2012)
The authors are attempting to determine how are momentum returns affected by different levels of capital investment within companies, on average. They calculate capital investment in three different ways: the capital expenditures as a percentage of fixed assets, the change in capital expenditures from year to year, and the change in accruals (i.e., working capital) from year to year.
Their population includes United States publicly trades stocks during the period 1965 - 2004, and on average, firm's capital expenditures tend to be 14.6% of total capital assets, and their expenditures on capital assets and working capital do not significantly change year to year, on average. These three measures of investment are also positively correlated with each other; but are not correlated with company size.
Next, the authors explored the momentum returns of this population to see what level of capital investment was made, on average, within different levels of momentum returns. They sorted the population into portfolio quintiles of prior returns spanning 3 - 12 months, and recorded the returns of those portfolios over holding periods of 3 - 12 months. Their results corroborate prior studies that find past winners outperform past winners in all formation and holding periods. In relation to capital investment, they find that the past winners tend to have lower capital investment than past losers, and the level of capital investment tends to have a U-shape with the level of past returns.
Next, the authors isolate the formation/holding period of 6 months to form 5x5 sorts of level of momentum and level of capital investment. They find that the best performing portfolio tends to have high momentum and high capital expenditure; and the worst performing portfolio tends to have low momentum and high capital expenditure. The momentum returns tend to increase almost monotonically as the level of capital expenditure increases within the highest ranking momentum stocks, but decreases almost monotonically as the level of capital expenditure increases in the lower momentum rankings. The momentum returns tend to exhibit a U-shape with increases in the other measures of capital investment (i.e., change in capital expenditures, and change in accruals). However, the long-only returns of all portfolios (i.e., not the zero-cost portfolios, which are discussed above) tend to decrease as capital investment increases; the reason the higher capital investment portfolio does well for the zero-cost portfolio is because the high momentum returns decrease slower than the low momentum returns at each increase in capital investment.
Next, the authors look at the returns of the zero-cost portfolio within different subperiods within the 1965 - 2004 period. Within all the subperiods, the momentum returns increase almost monotonically with each increase in capital expenditures. Within all subperiods, the momentum returns exhibit a U-Shape with each increase in change in capital expenditure and change in accruals.
Next, the authors did a 10x3 sort, with 10 levels of momentum and 3 levels of capital investment; for the momentum, they also looked at different lengths of formation and holding periods from 3 - 12 months. For the momentum returns, they calculated zero-cost portfolios as the top decile minus the bottom decile. In line with their prior results, they find the momentum returns to increase monotonically with each increase in level of capital expenditure across all formation/holding periods. In addition, they find the same U-shape of returns across changes in the change in capital expenditure and change in accruals.
Next, the authors formed a Fama French 3-factor regression (i.e., controlling the returns for market, size, and value returns) to explore the risk-adjusted returns for the portfolios. They find similar results as the prior results, where the highest alpha portfolio is the one with the highest momentum and highest capital expenditure, and the lowest alpha portfolio is the one with the lowest momentum and highest capital expenditure. The zero-cost alpha tends to increase as capital expenditures increase, and the portfolio alphas tend to decrease at each increase in capital expenditure. When looking at the change in capital expenditure and change in accrual methods, we see a decrease in portfolio alphas as capital investment increases, but the zero-cost alphas exhibit a U-shape in line with the results of prior tables.
Citation: Jiang, G., Li, D., & Li, G. (2012). Capital investment and momentum strategies. Review of Quantitative Finance & Accounting, 39(2), 165–188.
Link to paper: https://doi.org/10.1007/s11156-011-0250-3
Abstract: The main purpose of this paper is to investigate whether capital investment can affect stock price momentum. We provide empirical evidence that momentum strategies tend to be more profitable for stocks with large capital investment or investment changes. We present a simple explanation for our empirical results and show that our finding is consistent with the behavioral finance theory that characterizes investors' increased psychological bias and the more limited arbitrage opportunity when the estimation of firm value becomes more difficult or less accurate.
Sunday, April 7, 2019
Anomaly Interactions and the Cross-Section of Stock Returns. Karell, V., & Yeomans, J. S. (2018).
The authors want to understand how common anomalies in the literature affect portfolio returns when combined. To do so, they center in on the size, value, profitability, investment, and momentum anomalies. Historically, companies with smaller market capitalization, higher book-to-market ratios, higher return on assets, lower investments in assets, and past 6-month returns tend to outperform their respective complements.
They first look at the returns for each of these factors by putting them into quintiles and comparing returns across the 1971 - 2013 period in the US, excluding micro-cap companies which are found to be most sensitive to the factors in prior literature. They find all the factors to exhibit monotonic returns with changes in the quintiles in favor of the known factor relations.
They then split the quintiles into quintiles of the remaining factors into 5x5 portfolios to show the sensitivity of certain factors within the primary factors. They find that smaller companies tend to be more sensitive to size, profitability, and the investment factors, with momentum generally being unaffected by size (but this is consistent with prior studies that show momentum to increase only in the smallest of companies, which are excluded from this study). They then find that growth companies tend to be larger, more profitable, make higher investments in assets, and have higher momentum. Next, they find that less profitable companies tend to be smaller, categorized as value, make less investments, and to have no effect on momentum. Next, they find that companies who make smaller investments in assets seem to be smaller, be considered value, have lower profitability, and have no effect on momentum. Finally, high momentum companies tend to be characterized as growth and be irrespective of other factors.
Next the authors double-sorted the portfolios into 5x5 portfolios to see what are the returns of different levels of the factors in combinations. They also calculate a monotonic relationship to see which factors are likely to explain monotonic return increases with changes in those factors.
In relation to size, the authors find that the smallest companies are the only ones who show a monotonic increase in returns with increases to the value factor; none of the company sizes result in monotonic changes in returns with increases to the profitability factor; only the smallest companies show a monotonic increase in returns with increases to the investment factor; and all but one of the company size quintiles show a monotonic increase in returns with increases to the momentum factor.
In relation to value, the authors find that the top 3 quintiles of value show monotonic increases in returns with decreases in company size; none of the levels of book-to-price result in monotonic changes in returns with increases to the profitability factor, only companies in the top quintile of value show monotonic increases in returns with decreases in investment; and only the growth companies show monotonic increases in returns with increases in momentum.
In relation to profitability, there are monotonic relationships in several of the quintiles of the other factors; however, there does not seem to be a relationship where more or less profitable companies exhibit consistently higher or lower returns with increases or decreases in the other factors. In general, the returns of more or less profitable companies are not predictable in combination with other factors. However, companies with low profitability and high investment tend to perform the worst; while companies with low profitability and high momentum tend to perform the best. This contrast is evidence that level of profitability may not have an effect on returns when combining with other factors whose influence is more prominent.
In relation to investment, there are monotonic relationships with a few of the levels of company size and momentum; however, the changes in level of the other factors does not seem to have a monotonic relationship when controlling for level of investment. The highest return comes from high momentum, low investment companies as well as the low investment and small size companies; the smallest returns come from the high investment, low momentum companies.
In relation to momentum, the authors find the top 3 quintiles of momentum show monotonic increases in returns with decreases in company size; only the past losers tend to monotonically increase in return with increases to the value factor; and the changes in level of the other factors does not seem to have a monotonic relationship when controlling for the level of momentum. The highest returning portfolio seems to be the high momentum, with low investment, profitability, book-to-price ratios, or company size. The least profitable portfolio seems to be those with low momentum, combined with high investment or low book-to-price ratio.
Next, the authors pull the corner portfolios from the previously discussed 5x5 sort to explore the risk adjusted returns (i.e., sharpe ratios, volatility, SKAD) of long-only, short-only, and zero-cost portfolios with each factor combination. They find that the long-only portfolio outperforms the short-only portfolio in all cases except one (i.e., the ROA/BP portfolio). They find that the highest sharpe ratio of the zero-cost portfolio comes from the BP/MOM portfolio, which is in line with prior studies that find combining value companies with momentum companies creates good diversification effects and therefore good risk-adjusted returns. This portfolio also has the second-highest long-only return (i.e., after BP/ROA). Portfolios that include the investment factor also tend to be the ones with the highest sharpe ratios.
Finally, the authors form Fama-McBeth regressions with each of the factors to see how much of the portfolios' returns are explained by the factors. When considering only two factors at a time, they find that a 1 standard deviation increase in the book-to-price ratio and past 6-month return can produce a 4.1% increase in return to the portfolio; and a 1 standard deviation decrease in the past year percentage change in assets and increase in past 6-month returns can produce a 4.3% increase in return to the portfolio. When all factors are regressed at once, they find a 1 standard deviation decrease in the past year percentage change in assets and increase in past 6-month returns can produce a 4.2% increase in return to the portfolio; the value factor was not statistically significant in the all-factor regression. The authors suggest the likely reason the other factors are not prominent is because they are mostly emphasized in micro-cap companies which are excluded from this study. The investment and momentum factors are significant in all combinations with other factors.
Karell, V., & Yeomans, J. S. (2018). Anomaly Interactions and the Cross-Section of Stock Returns. Fuzzy Economic Review, 23(1), 33–61.
Sunday, March 31, 2019
Portfolio - 03/30/2019
Our current portfolio is composed of 20
stocks, the top 5 of
which are Total SA (TOT), Medtronic plc (MDT), Cigna Corp (CI), United Healthcare (UNH), and Intel Corporation (INTC).
The portfolio is composed 100% of large-cap equities, 42% of which are
classified as Value, 45% Core, and 13% Growth. Energy, Healthcare, and Technology sectors make up 74% of
the
portfolio. Its P/E ratio and P/B ratios are 82% and 80% of the S&P
500’s, respectively, and
its dividend yields 36% more than the S&P 500.
About Sawyer Investment Management Company:
SIMCO
is a Texas-registered Investment Adviser with its principal place of
business in Dallas, Texas. It was formed on January 1, 2015 and is
wholly owned by Ryan Sawyer, who is a CFA Charterholder and a Certified
Public Accountant.
SIMCO specializes in the construction of equity portfolios, and is therefore an ideal resource for long-term investors. The firm goes through a rigorous process for selecting each and every holding in the portfolio. Rooted in the empirical research of academia, the portfolios are generally characterized as large-cap value momentum. For more information about how the portfolios are managed, see our website.
www.sawyerinvestment.com
https://www.facebook.com/SawyerInvestment
https://twitter.com/SawyerInvest
https://sawyerinvestment.blogspot.com/
SIMCO specializes in the construction of equity portfolios, and is therefore an ideal resource for long-term investors. The firm goes through a rigorous process for selecting each and every holding in the portfolio. Rooted in the empirical research of academia, the portfolios are generally characterized as large-cap value momentum. For more information about how the portfolios are managed, see our website.
www.sawyerinvestment.com
https://www.facebook.com/SawyerInvestment
https://twitter.com/SawyerInvest
https://sawyerinvestment.blogspot.com/
Tuesday, March 26, 2019
Momentum meets value investing in a small European Market. Labao & Azeredo (2018)
The authors explore the Portuguese stock market over the period 1988 - 2015, and they want to learn the performance of portfolios that have characteristics of both value and momentum.
First, they form zero-cost portfolios for value (Price-to-book) and momentum (past returns) by finding the return of the top third ranking minus the bottom third ranking portfolios; then they form a portfolio that attributes 50% of the return of the zero-cost value portfolio and 50% of the return of the zero-cost momentum portfolio.
They first analyze this combined portfolio by looking at different observation and holding periods (i.e., 1 -12 months for each). They find that in all observation and holding periods, the combined zero-cost portfolio has positive average returns. The 1 month holding period seems to have the highest returns; however, longer holding periods tend to have less volatility resulting in higher sharpe ratios and alphas. The 1-month and 12-month holding periods seem to have less significant t-statistics than the 3-month to 9-month holding periods.
Next, the authors broke down the returns into subperiods and split the combined portfolio into its momentum and value components. They find that the combined portfolio tends to perform best in late-stage bull markets. They also find that the momentum portfolio performs well in all subperiods; whereas, the value portfolio has ups and downs. Finally, they find a correlation between the value and momentum portfolio of -0.22, signally great diversification ability by combining the two characteristics.
Next, the authors look at the performance of the value and momentum portfolios at different holding periods. They find that the value portfolio continues to increase in performance through about 2 years, then levels off. The momentum portfolio increases in performance through the first year, then decreases to 0% by the end of the third year.
Next, the authors sort the value and momentum portfolio thirds into 9 portfolios (i.e., past winners - value, past winners - growth, past losers - value, past losers - growth, and so on). They find in all cases that combining the top winners with value outperforms past losers with growth monotonically.
Finally, the authors explore holding the value/past winner portfolio versus holding the growth/past loser over a five year period. The return of holding the value/winner portfolio exceeds the growth/loser portfolio by about 1.5% for up to 2 years; then this excess return steadily decreases until the difference in return is about 0.3% by year 5.
Lobão, J., & Azeredo, M. (2018). Momentum meets value investing in a small European market. Portuguese Economic Journal, 17(1), 45–58.
Sunday, March 24, 2019
Portfolio 03/23/2019
Our current portfolio is composed of 20
stocks, the top 5 of
which are Total SA (TOT), Medtronic plc (MDT), Cigna Corp (CI), United Healthcare (UNH), and Intel Corporation (INTC).
The portfolio is composed 97% of large-cap equities, 39% of which are
classified as Value, 47% Core, and 11% Growth. Energy, Healthcare, and Technology sectors make up 68% of
the
portfolio. Its P/E ratio and P/B ratios are 84% and 84% of the S&P
500’s, respectively, and
its dividend yields 52% more than the S&P 500.
About Sawyer Investment Management Company:
SIMCO
is a Texas-registered Investment Adviser with its principal place of
business in Dallas, Texas. It was formed on January 1, 2015 and is
wholly owned by Ryan Sawyer, who is a CFA Charterholder and a Certified
Public Accountant.
SIMCO specializes in the construction of equity portfolios, and is therefore an ideal resource for long-term investors. The firm goes through a rigorous process for selecting each and every holding in the portfolio. Rooted in the empirical research of academia, the portfolios are generally characterized as large-cap value momentum. For more information about how the portfolios are managed, see our website.
www.sawyerinvestment.com
https://www.facebook.com/SawyerInvestment
https://twitter.com/SawyerInvest
https://sawyerinvestment.blogspot.com/
SIMCO specializes in the construction of equity portfolios, and is therefore an ideal resource for long-term investors. The firm goes through a rigorous process for selecting each and every holding in the portfolio. Rooted in the empirical research of academia, the portfolios are generally characterized as large-cap value momentum. For more information about how the portfolios are managed, see our website.
www.sawyerinvestment.com
https://www.facebook.com/SawyerInvestment
https://twitter.com/SawyerInvest
https://sawyerinvestment.blogspot.com/
Friday, March 22, 2019
Our current portfolio is composed of 20
stocks, the top 5 of
which are Total SA (TOT), General Mills Inc (GIS), Cigna Corp (CI), Medtronic plc (MDT), and Intel Corporation (INTC).
The portfolio is composed 93% of large-cap equities, 37% of which are
classified as Value, 47% Core, and 10% Growth. Energy, Healthcare, and Consumer Defensive sectors make up 57% of
the
portfolio. Its P/E ratio and P/B ratios are 90% and 92% of the S&P
500’s, respectively, and
its dividend yields 57% more than the S&P 500.
About Sawyer Investment Management Company:
SIMCO
is a Texas-registered Investment Adviser with its principal place of
business in Dallas, Texas. It was formed on January 1, 2015 and is
wholly owned by Ryan Sawyer, who is a CFA Charterholder and a Certified
Public Accountant.
SIMCO specializes in the construction of equity portfolios, and is therefore an ideal resource for long-term investors. The firm goes through a rigorous process for selecting each and every holding in the portfolio. Rooted in the empirical research of academia, the portfolios are generally characterized as large-cap value momentum. For more information about how the portfolios are managed, see our website.
www.sawyerinvestment.com
https://www.facebook.com/SawyerInvestment
https://twitter.com/SawyerInvest
https://sawyerinvestment.blogspot.com/
SIMCO specializes in the construction of equity portfolios, and is therefore an ideal resource for long-term investors. The firm goes through a rigorous process for selecting each and every holding in the portfolio. Rooted in the empirical research of academia, the portfolios are generally characterized as large-cap value momentum. For more information about how the portfolios are managed, see our website.
www.sawyerinvestment.com
https://www.facebook.com/SawyerInvestment
https://twitter.com/SawyerInvest
https://sawyerinvestment.blogspot.com/
Friday, March 15, 2019
Empirical Evidence of the Existence of Investable Premiums in Emerging Market Investable Stocks. Girard (2010)
The authors set out to explore the investability premium (i.e., a premium earned on stocks in countries where foreigners can more easily invest in them) in emerging market countries. The thought is that if the stocks in a country are more investable, then a premium will be required by foreign investors due to increased risk (e.g., currency risk, information asymmetry, government risk, etc.).
They first create a regression that is composed of the market return, and the size, value, momentum and investability premiums. They find that for all the 29 countries in the 1988-2006 period, each of the premiums is statistically significant. They find that on average, higher beta, large-cap, growth, past winners, and more investable companies tend to outperform lower beta, small-cap, value, past losers and less investable companies.
Next, they split these regressions into upstate and downstate regimes. They find the same conclusion for each of the regimes as was found overall, except for the market beta and the investable premium (both of which reverse sign). So, in a downstate, less investable companies outperform more investable companies, and lower beta stocks outperform higher beta stocks.
Next, they create four regressions that start with the investability premium and adds the other factors sequentially. In all cases, the market return is the most significant explainer of stock returns on average, followed by the investability premium. Then, by splitting these regressions into "less investable" and "more "more investable" tiers, they find that the investable premium becomes more significant (and the other factors become less significant) as the level of investability of the companies increases.
Finally, the authors split the previous regression into two regimes (the 1988-1995 period and the 2000-2006 period). They find the same results as the overall time period, where the market return and the investability premium are the primary determinants of market returns, and as the investability of the companies increases, the investability premium becomes more significant as an explainer of returns.
Girard, E. C. (2010). Empirical Evidence of the Existence of Investable Premiums in Emerging Market Investable Stocks. Financial Review, 45(4), 1025–1051.
Tuesday, March 12, 2019
Portfolio 03/09/2019
Our current portfolio is composed of 20
stocks, the top 5 of
which are Total SA (TOT), General Mills Inc (GIS), Cigna Corp (CI), United Healthcare (UNH), and Intel Corporation (INTC).
The portfolio is composed 98% of large-cap equities, 39% of which are
classified as Value, 45% Core, and 13% Growth. Energy, Healthcare, and Technology sectors make up 68% of
the
portfolio. Its P/E ratio and P/B ratios are 91% and 95% of the S&P
500’s, respectively, and
its dividend yields 56% more than the S&P 500.
About Sawyer Investment Management Company:
SIMCO
is a Texas-registered Investment Adviser with its principal place of
business in Dallas, Texas. It was formed on January 1, 2015 and is
wholly owned by Ryan Sawyer, who is a CFA Charterholder and a Certified
Public Accountant.
SIMCO specializes in the construction of equity portfolios, and is therefore an ideal resource for long-term investors. The firm goes through a rigorous process for selecting each and every holding in the portfolio. Rooted in the empirical research of academia, the portfolios are generally characterized as large-cap value momentum. For more information about how the portfolios are managed, see our website.
www.sawyerinvestment.com
https://www.facebook.com/SawyerInvestment
https://twitter.com/SawyerInvest
https://sawyerinvestment.blogspot.com/
SIMCO specializes in the construction of equity portfolios, and is therefore an ideal resource for long-term investors. The firm goes through a rigorous process for selecting each and every holding in the portfolio. Rooted in the empirical research of academia, the portfolios are generally characterized as large-cap value momentum. For more information about how the portfolios are managed, see our website.
www.sawyerinvestment.com
https://www.facebook.com/SawyerInvestment
https://twitter.com/SawyerInvest
https://sawyerinvestment.blogspot.com/
Saturday, March 9, 2019
A tale of two states: asymmetries in the UK small, value and momentum premiums. Sarwar et al (2017)
The authors are looking to explore the style premiums in the UK over the 1982 - 2014 period. They also want to explore how the premiums are affected by various macroeconomic indicators in expansionary and recessionary regimes.
First, they look at the size, value, and momentum premiums over the full period and find the momentum period to be 0.95%, followed by the value premium at 0.34%, and finally the size premium at 0.12%. Next, they split the sample into expansion and recession regimes and find that the value and momentum premiums remain the same no matter if in an expansionary or recessionary regime; however, they find that the size premium actually goes negative during a recession. They also find that the size premium is positively skewed, while the value and momentum premiums are negatively skewed, no matter the regime.
Next, the authors regress various macroeconomic indicators against the size, value, and momentum factor premiums. They find that increases to the GDP growth rate, inflation, and money supply significantly explain increases to the size premium; increases to the short-term interest rates and credit spread significantly explain an increase to the value premium; and no macroeconomic indicators significantly explain the changes in the momentum premium. However, the R^2 of the regressions are very small, so the regression equation likely does not provide a good enough fit.
Next, the authors split that sample into two regimes: expansion and recession; where they regress the same macroeconomic indicators against the same factor premiums in the two different regimes. They find that the alphas in the regression equation are negative for the size and value premiums, so investors are likely better off owning large-gap growth companies during a recession; also, the factor premium for momentum is significantly less during a recession than in an expansion.
An increase to the GDP growth rate positively explains the size and value premiums in an expansion; however, it negatively explains the value premium in a recession. The authors suggest that value companies tend to be in certain industries that don't turn around until late in the economic cycle, thereby foregoing the benefits of GDP growth during the recession.
An increase to inflation positively explains the size premium in both regimes, but is insignificant for the other factors. The authors suggest that it's easier for smaller companies to pass along price increases, so they would maintain their profitability.
An increase to the short-term interest rates positively explains the size premium in a recession; the authors suggest that small companies have a more difficult time obtaining capital, so an increase to interest rates hurts them more than large companies, and they therefore earn a premium for that risk. An increase to short-term interest rates positively explains the value premium in both regimes; the authors suggest that value companies are much more leveraged than growth companies, and investors would require a higher premium over growth companies for taking on that risk during a rising rate environment. An increase to short-term interest rates negatively explains the momentum premium in both regimes.
An increase to the term structure positively explains the size premium in a recession. An increase to the term structure positively explains the value premium in an expansion and negatively explains the value premium in a recession; the authors suggest that growth companies don't pay as high a dividend, so when the credit spread increase, the investors require a higher premium to compensate them for the higher rate environment that they are foregoing. An increase in the term structure negatively explains the momentum premium in a recession; the authors suggest that the past winner are typically higher beta, so as the term spread increases, the market price goes down and more severely affects the higher beta companies than the lower beta companies.
An increase to the credit spread positively affects the size and value premiums in both regimes. An increase to the credit spread negatively affects the momentum premium in an expansion and positively affects the momentum premium in a recession.
An increase to the money supply does not significantly affect any of the factors in an expansion; however, it is positively related to the size factor and negatively related to the value factor in a recession. The authors suggest that smaller companies do not have as easy access to the growth in the money supply that bigger companies do, so investors require a higher premium for not being relieved from the ongoing recession.
Sarwar, G., Mateus, C., & Todorovic, N. (2017). A tale of two states: asymmetries in the UK small, value and momentum premiums. Applied Economics, 49(5), 456–476.
Tuesday, March 5, 2019
Portfolio 03/02/2019
Our current portfolio is composed of 20
stocks, the top 5 of
which are Total SA (TOT), General Mills Inc (GIS), Sanofi (SNY), AT&T Inc (T), and Intel Corporation (INTC).
The portfolio is composed 100% of large-cap equities, 42% of which are
classified as Value, 48% Core, and 7% Growth. Energy, Healthcare, and Technology sectors make up 58% of
the
portfolio. Its P/E ratio and P/B ratios are 88% and 83% of the S&P
500’s, respectively, and
its dividend yields 89% more than the S&P 500.
About Sawyer Investment Management Company:
SIMCO
is a Texas-registered Investment Adviser with its principal place of
business in Dallas, Texas. It was formed on January 1, 2015 and is
wholly owned by Ryan Sawyer, who is a CFA Charterholder and a Certified
Public Accountant.
SIMCO specializes in the construction of equity portfolios, and is therefore an ideal resource for long-term investors. The firm goes through a rigorous process for selecting each and every holding in the portfolio. Rooted in the empirical research of academia, the portfolios are generally characterized as large-cap value momentum. For more information about how the portfolios are managed, see our website.
www.sawyerinvestment.com
https://www.facebook.com/SawyerInvestment
https://twitter.com/SawyerInvest
https://sawyerinvestment.blogspot.com/
SIMCO specializes in the construction of equity portfolios, and is therefore an ideal resource for long-term investors. The firm goes through a rigorous process for selecting each and every holding in the portfolio. Rooted in the empirical research of academia, the portfolios are generally characterized as large-cap value momentum. For more information about how the portfolios are managed, see our website.
www.sawyerinvestment.com
https://www.facebook.com/SawyerInvestment
https://twitter.com/SawyerInvest
https://sawyerinvestment.blogspot.com/
Saturday, March 2, 2019
The Australia Asset-Pricing Debate. Durand et al (2016)
The authors want to explore which of the commonly used models best explains the cross section of returns of the Australian stock market. The commonly used models in the US are the Fama-French 3-factor model, which includes market, size, and value factors. Another model is the Fama-French-Carhart model, which adds momentum. They also want to explore how liquidity and the US market influence the returns of the Australian stock market.
First, by using the 4-factor model, they find that the Australian value and momentum factors significantly explain the returns; however, none of the US factors are statistically significant in explaining the returns. Although the authors do find a high correlation between the US factors and the AUS factors; most notably, the market factor of the US is 0.72 correlated with the AUS market factors.
To dig deeper into the influence of the US market, the authors create another model that includes the 4-factor model for the US and the 4-factor model for the AUS (orthogonalized) into a single model. They then compare the 3-factor, AUS 4-factor, combined model, and combined+liquidity factor model. They find that the alphas of each of the models is statistically unlikely to be zero; therefore, we could conclude that none of the models' factors fully explain the cross section of returns in the Australian stock market. Although the R^2 of the combined model is 0.76 and provides the best fit when compared to the other models.
Next, the authors explored the factor coefficients and t-statistics in each of the 25 portfolios (created in line with the Fama-French method) for the combined model. They find that approximately half of the portfolios have statistically significant alphas; in particular, the largest capitalization and highest book-to-market portfolios have insignificant alphas and might pass the Merton zero-alpha test. The AUS market-beta is significant for all portfolios, the AUS size beta is significant for most portfolios, the AUS value factor is significant for only the high book-to-market portfolios, and the AUS momentum does not explain returns across many of the portfolios. The US market, size, and value factors significantly explain the returns of most of the portfolios, although the US momentum factor does not.
Next, the authors added a liquidity factor to the combined model. They find that the coefficient on the liquidity factor was not statistically significant for most of the portfolios.
Next, they perform a Wald test for the US factors, which measures whether each of the factors is jointly significant in each of the 25 portfolios. They find that all the US factors (i.e., market, size, value, and momentum) significantly explain the returns of the AUS stock market; however, they find that the liquidity factor does not add much explanatory power to the model.
Finally, the authors sorted the portfolios by the Brailsford portfolio/factor construction method (which is a bit different than the Fama-French method used before); they find the US 4-factor model is the only one with an insignificant GRS, so it seems to be the best at explaining the returns of the AUS stock market.
Durand, R. B., Limkriangkrai, M., Chai, D., & Gallagher, D. (2016). The Australian asset-pricing debate. Accounting & Finance, 56(2), 393–421
First, by using the 4-factor model, they find that the Australian value and momentum factors significantly explain the returns; however, none of the US factors are statistically significant in explaining the returns. Although the authors do find a high correlation between the US factors and the AUS factors; most notably, the market factor of the US is 0.72 correlated with the AUS market factors.
To dig deeper into the influence of the US market, the authors create another model that includes the 4-factor model for the US and the 4-factor model for the AUS (orthogonalized) into a single model. They then compare the 3-factor, AUS 4-factor, combined model, and combined+liquidity factor model. They find that the alphas of each of the models is statistically unlikely to be zero; therefore, we could conclude that none of the models' factors fully explain the cross section of returns in the Australian stock market. Although the R^2 of the combined model is 0.76 and provides the best fit when compared to the other models.
Next, the authors explored the factor coefficients and t-statistics in each of the 25 portfolios (created in line with the Fama-French method) for the combined model. They find that approximately half of the portfolios have statistically significant alphas; in particular, the largest capitalization and highest book-to-market portfolios have insignificant alphas and might pass the Merton zero-alpha test. The AUS market-beta is significant for all portfolios, the AUS size beta is significant for most portfolios, the AUS value factor is significant for only the high book-to-market portfolios, and the AUS momentum does not explain returns across many of the portfolios. The US market, size, and value factors significantly explain the returns of most of the portfolios, although the US momentum factor does not.
Next, the authors added a liquidity factor to the combined model. They find that the coefficient on the liquidity factor was not statistically significant for most of the portfolios.
Next, they perform a Wald test for the US factors, which measures whether each of the factors is jointly significant in each of the 25 portfolios. They find that all the US factors (i.e., market, size, value, and momentum) significantly explain the returns of the AUS stock market; however, they find that the liquidity factor does not add much explanatory power to the model.
Finally, the authors sorted the portfolios by the Brailsford portfolio/factor construction method (which is a bit different than the Fama-French method used before); they find the US 4-factor model is the only one with an insignificant GRS, so it seems to be the best at explaining the returns of the AUS stock market.
Subscribe to:
Posts (Atom)