Table 1: Performance of Value and Momentum Portfolios Across Markets and Asset Classes (0:00)
The authors study the period 1972-2011 for US, UK, Europe, and Japan stocks. They rank the stocks in each of the markets by value and momentum characteristics, and form portfolios for the top third, middle third, and low third of stocks according to those rankings. They then calculate the mean returns, standard deviation, sharpe ratio, and alpha figures for each of the three portfolios in each of the 4 markets, including value-only, momentum-only, and 50/50 value/momentum.
They find monotonic increases in excess returns from P1 to P3 for the value, momentum, and combined portfolios; and these excess returns have significant t-statistics. They also find a monotonically increasing and statistically significant sharpe ratio as the value/momentum rankings increase. The major finding, though, is the results when the value and momentum portfolios are combined. In that case, there is still a significant excess return; but with the combined portfolio, the standard deviation is much lower resulting in a significantly higher sharpe ratio than if the value or momentum portfolios were invested alone. This is because the correlation of returns for the value and momentum portfolios are significantly negatively correlated (i.e., a correlation less than -0.60 in most cases).

Next, the authors explored the same value and momentum effects for different asset classes (i.e., country indices, currencies, fixed income, and commodities). They find the same results as those found in the equities discussed above: significant excess returns, sharpe ratios, and alphas (with the exception of fixed income). They also found that by combining value and momentum portfolios, the performance metrics were significantly improved over what they were for value and momentum isolated. The authors also find that when they combine all asset classes in a combined value/momentum portfolio, they achieve a sharpe ratio greater than 1.35, which is higher than any of the asset classes or markets when isolated. This is due to a significantly reduced standard deviation because of diversification effects, while the excess returns remain elevated.

Next, the authors explore some more value and momentum metrics for fixed income, since the metrics they used before (i.e., the 5 year change in yield) did not perform well. They added the real bond yield and the term spread as a metric in the analysis. They find that when using these measures of value, the performance metrics become large and statistically significant; so maybe the value/momentum effect is present in fixed income as well (you just have to use the appropriate measure of value).

Table 2: Correlation of Value and Momentum Strategies Across Markets and Asset Classes (10:33)
Next, the authors analyze the correlations across the markets as well as the asset classes and value vs momentum strategies. They find that the correlations between stock value and momentum strategies are significantly negative; this goes for non-stock value and momentum strategies as well (albeit, less significantly negative). They also find that stock value (momentum) strategies are slightly positively correlated with non-stock value (momentum) strategies. Finally, they look at the correlations of the markets (i.e., US, UK, Japan, and Europe) within value and momentum strategies, and they find those markets to be significantly positively correlated within both stock and non-stock returns.
Next, the authors explore the correlations of stock strategies to non-stock strategies. They find in all cases that the stock value (momentum) strategies are positively correlated with non-stock value (momentum) strategies, and that stock value (momentum) strategies are negatively correlated with non-stock momentum (value) strategies.

Figure 1: First Principal Component for Value and Momentum Strategies (13:50)
Next, the authors explore the first principal components for value and momentum strategies. They find that the first principal components of the momentum strategies are all loaded in the same direction for each of the markets (i.e., US, UK, Europe, and Japan); also, all the first principal components of the value strategies are loaded in the same direction for each of the markets, and in an opposite direction of the momentum strategies (exhibiting a negative correlation between value and momentum strategies in each market).
Next, they perform the same analysis across asset classes (i.e., stocks, countries, currencies, bonds, and commodities), and they find that the first principal components of the momentum strategies are all loaded in the same direction for each asset class; and all the first principal components of the value strategies are loaded in the same direction for each of the asset classes, and in an opposite direction of the momentum strategies (showing the negative correlation between value and momentum strategies in each asset class).
As such, there must be a common global factor structure that produces these results across all asset classes and markets.

Figure 2: Cumulative Returns to Value and Momentum Strategies Across Markets and Asset Classes (15:39)
Next, the authors look at the cumulative returns of value, momentum, and combined strategies across markets and asset classes. They find that in all markets and asset classes, the combined value/momentum strategy outperforms either the value or momentum strategy on its own. They also find the value and momentum returns are significantly negatively correlated, causing a significantly higher sharpe ratio in the combined strategy than in the value or momentum strategies alone.


Table 3: Macroeconomic Risk Exposures (16:52)
Next, given the prevalence of the outperformance across markets and asset classes, the authors explore the macroeconomic risk exposures of these strategies to see if there is a common influence on the returns. They find that returns of US value strategies are positively related to long-run consumption growth, term structure, and default risk and negatively related to the market return; returns of US momentum strategies are negatively related to default risk, and unrelated to other macroeconomic factors; returns of global value stocks are positively related to default risk; returns of global momentum stocks are negatively related to default risk; returns of non-stock assets are negatively related to term risk; and returns of non-stock momentum strategies are negatively related to recessions and GDP growth.
As such, default risk seems to be the common source of returns for the value and momentum strategies across asset classes and markets (i.e., returns of value strategies are positively related to default risk and returns of momentum strategies are negatively related to default risk).

Table 4: Liquidity Risk Exposures (19:46)
Next, the authors explore the relationship of value and momentum strategies to liquidity risk measures (in particular, those of funding liquidity and market liquidity). For the US market, they find that returns of value strategies tend to be negatively related to liquidity risk and returns of momentum strategies tend to be positively related to liquidity risk. And in the combined value/momentum strategy, there is no relationship between liquidity risk and the returns of the combined portfolio, suggesting the combined strategy diversifies out the liquidity risk. They find the same results on a global basis as well.


Figure 3: Time Series of Global Liquidity Shocks (21:05)
As a robustness test of the liquidity risk measures, the authors plotted the shocks over the past 25 years, noting they coincide with well-known market shocks.

Figure 4: Liquidity Risk Beta t-statistics (24:41)
Next, the authors look at the t-statistics of the liquidity risk factors within the regression. They find that looking at the individual markets and asset classes individually produce insignificant t-statistics; however, when the asset classes and markets are averaged together, the t-statistics become significant. Had the markets and asset classes not been combined, it might have been found that there is no relationship between liquidity risk and the value and momentum strategies.

Figure 5: Explaining Value and Momentum in One Market with Value and Momentum in Other Markets (25:40)
Next, the authors form regressions for each of the high, low, medium portfolios across each market and each asset class. Then using those regressions, they calculate an expected return and compare that to the actual return for each portfolio. They find that a regression with just the market, value, and momentum factors (the AMP 3-factor model) on a global basis do a reasonable job of predicting actual returns, with an R^2 of 0.55 and a very small alpha.

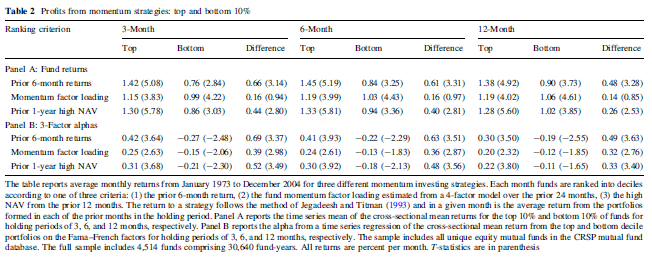
Figure 6: Asset Pricing Tests of the Cross Section of Expected Returns (28:31)
Next, the authors perform this same regression using other common asset pricing models, such as the CAPM and the Fama-French 4-factor and 6-factor models. They find their AMP 3-factor model (at an R^2 of 0.71) does a better job at predicting the actual returns to the portfolios than do the other common pricing models. They also perform this for US assets only, using the global factor loadings; they find that the Fama-French 4-factor and 6-factor models do a better job at predicting the portfolio returns than does the AMP 3-factor model, but this is because the AMP model is using global data to form the regression, while the Fama-French models are using US data to form the regressions. It makes sense that US data does better at predicting US returns; however, the authors want to emphasize how well the global data in the AMP model predicts returns of US assets, further exhibiting the interconnectedness of the markets and factors.

Table 5: Cross-Sectional Asset Pricing Tests of Global Value and Momentum Strategies (31:58)
Next, the authors want to see how various economic indicators explain the returns of each of the 48 portfolios in this study. They find that liquidity risk is significantly positively related to the returns of the portfolios when regressed along, and term risk and default risk are also significantly related; however, when those risk measures are combined in a regression, the liquidity risk subsumes the term and default risk; and further, when value and momentum factors are included in the regression, the liquidity risk is subsumed by those factors. As such, the value and momentum premiums may be capturing liquidity risk.
Next, the authors explore funding and market liquidity separately, and they find that the funding liquidity is the factor that has the most influence on the returns (and not necessarily market liquidity); in both cases, however, the value and momentum factors subsume the liquidity risk measure.

Table 6: Time Series Asset Pricing Tests of Global Value and Momentum Strategies (34:42)
Next, the authors explore the regressions of several asset pricing models (i.e., the CAPM, Fama-French models, macroeconomic models, and APM 3-factor model). They find the APM 3-factor model best explains the cross-section of returns (i.e., it has the highest R^2, the lowest alpha, and the lowest F-stat). This means that a regression with the global zero-cost value, zero-cost momentum, and market factor do a good job of explaining the returns to these portfolios.
Next, they use the Fama-French 25 value / 25 momentum portfolios for forming the regression. As we saw in a previous table, the Fama-French 6-factor model does a better job of explaining the US returns because it uses US data in forming the regression; but the AMP 3-factor model (global market, value and momentum) still does a good job of explaining the returns.
Next, the authors explore how well the models can explain hedge fund returns (given the increased use by hedge funds in using factor-based portfolios). They find the AMP 3-factor model does the best at explaining the hedge-fund returns.


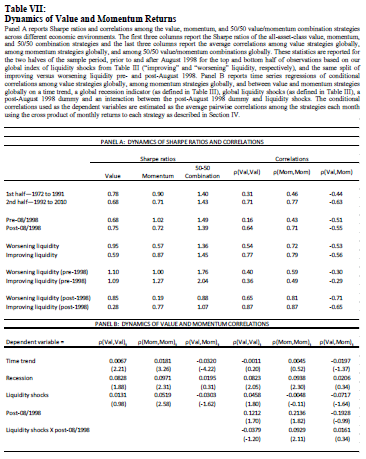
Table 7: Dynamics of Value and Momentum Returns (40:07)
Abstract
We study the returns to value and momentum strategies jointly across eight diverse markets and asset classes. Finding consistent value and momentum premia in every asset class, we further find strong common factor structure among their returns. Value and momentum are more positively correlated across asset classes than passive exposures to the asset classes themselves. However, value and momentum are negatively correlated both within and across asset classes. Our results indicate the presence of common global risks that we characterize with a three factor model. Global funding liquidity risk is a partial source of these patterns, which are identifiable only when examining value and momentum simultaneously across markets. Our findings present a challenge to existing behavioral, institutional, and rational asset pricing theories that largely focus on U.S. equities.
Suggested Citation:
Asness, Cliff S. and Moskowitz, Tobias J. and Pedersen, Lasse
Heje, Value and Momentum Everywhere (June 1, 2012). Chicago Booth
Research Paper No. 12-53; Fama-Miller Working Paper. Available at SSRN: https://ssrn.com/abstract=2174501 or http://dx.doi.org/10.2139/ssrn.2174501