Using the Fed Model to determine appropriate stock market P/E levels is flawed, primarily due to stocks being "real" assets and bonds being "nominal" assets.
0:00 - Introduction
This is a paper called "Fight the Fed Model" by Cliff Asness of AQR Capital Management, LLC. In the paper, he discusses the relationship between stock market yields, bond market yields, and future returns in an effort to analyze the validity of the Fed Model.
0:00 - Introduction
This is a paper called "Fight the Fed Model" by Cliff Asness of AQR Capital Management, LLC. In the paper, he discusses the relationship between stock market yields, bond market yields, and future returns in an effort to analyze the validity of the Fed Model.
The Fed Model states that the stock market yield (i.e., Earnings divided by Price, or E/P) should generally be equal to the bond market yield (i.e., the yield on the 10-year treasury, or Y). When E/P exceeds Y, stocks are considered cheap; when E/P is less than Y, stocks are considered expensive.
0:41 - Section 3. Arguments in Favor of the Fed Model
There are generally 3 arguments in favor of the Fed Model:
- The Competing Assets Argument: This rationalizes that an investor could either buy stocks or he could buy bonds, so those securities are competing. If stocks are cheaper than bonds (i.e., they have a higher yield) or are expected to have a higher risk-adjusted return, investors should buy stocks instead of bonds.
- The Present Value Argument: In present value models, the interest rate is embedded in the denominator; therefore, decreases in interest rates should produce higher stock valuations and ultimately a lower earnings yield (or equivalently a higher P/E ratio). As such, movements in the P/E ratio should be inversely related to movements in interest rates.
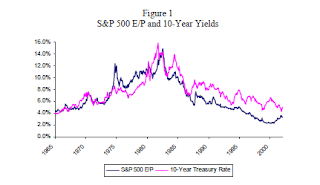
- The Historical Data Argument: Historically (i.e., since 1965), the S&P 500 E/P has moved in line with 10-Year treasury yields, and actually has a 0.81 correlation! In addition, the S&P 500 P/E ratio has historically been inversely related to the level of inflation (which is a primary component of interest rates).
2:18 - Section 3. Arguments Against the Fed Model
Next, the author starts with the dividend discount model, and after making several substitutions, comes to the following model of real returns for stocks. The model generally says that real returns to owning a stock should be equal to half of the earnings yield (assuming a dividend payout ratio of 50%) plus real long-term earnings growth:
In a scenario where the inflation rate changes, the real return to owning the stock should stay the same as well (i.e., because it is net of inflation); therefore, the right side of the equation has to remain the same also. Since the real growth rate is net of inflation, then the nominal growth rate must have to change to counteract the change in inflation; which makes since, because changes in inflation should change the revenues and expenses earned by the company, and ultimately its profit level, in line with that inflation changed.
Fed Modelers would argue that the E/P in the equation should change with the change in inflation; but our analysis above points to the more likely scenario that the nominal growth rate changes instead.
6:10 - Section 3. Arguments Against the Fed Model (cont')
To verify this empirically, the author forms a regression with the nominal earnings growth as the dependent variable and inflation as the independent variable. He finds that historical changes in the inflation rate change the nominal earnings growth rate with almost a 1:1 relationship (i.e., the beta on inflation has a 0.94 coefficient). This means that, on average, 94% of decade-long inflation showed up in nominal earnings growth, explaining 36.5% of earnings' variation. This is in line with our analysis above, and in stark contrast to the thought process of Fed Modelers.
So now that we understand the arguments for and against the Fed Model, we can revisit each of the Arguments and conclude on their efficacy (or lack thereof):
- The Competing Assets Argument: The argument was that the yields of stocks and bonds should be about the same; and investors should choose the asset class that yields more than the other. However, as we've seen, the Fed Modelers have left out the understanding that stocks have an earnings growth rate that moves with inflation, while bonds do not. As such, comparing the two without adjusting for this growth causes an error in thinking.
- The Present Value Argument: The argument is that changes to inflation (and therefore interest rates) should adjust the denominator in the present value of cash flows formula, resulting in a change to the present value. Which is true; however, the Fed Modelers have failed to take into account that the change in inflation will also change the cash flows in the numerator of the equation, which counteracts the change in the discount rate in the denominator. As such, a change in inflation should not materially change the present value of cash flows.
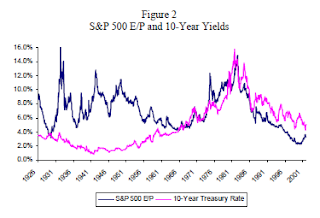
- The Historical Data Argument: In Figure 1 and Table 1, we saw that P/E ratios move inversely to interest rates and inflation rates over the 1965 - 2001 period, with a high correlation. However, if we were to consider this relationship back to 1926, we would see that the relationship falls apart during the 1926 - 1965 period, with a very low correlation. Therefore, have investors had a mistaking in thinking in more recent times when deciding appropriate P/E ratios?
15:54 - Table 2. Forecasting 10-Year Real S&P 500 Returns
Next, the author runs a few regressions with the dependent variable being the average 10-year rollings S&P 500 returns, and the independent variables being the E/P, Y, and E/P-Y. The thought process is that if the Traditional Model holds (i.e., the primary driver of returns is the earnings yield), the E/P should be statistically significant, while the other two variables are insignificant; if the Fed Model holds (i.e., the primary driver of returns is the difference between the earnings yield and 10-year treasury yield), the E/P-Y variable should be significant.
The authors find that over the 1881-2001, 1926-2001, and 1955-2001 time periods, the E/P is significantly positively related to the real S&P 500 returns, while neither the 10-year treasury yield nor the E/P-Y variable are statistically significant. This would lead us to believe the earnings yield is the primary driver of returns, and the traditional model holds (and the Fed Model fails).
19:11 - Table 3. Forecasting 20-Year Real S&P 500 Returns
Next, the author performs the same regression over the 1881-2001 and 1926-2001 time periods, only this time the dependent variable is average rolling 20-year returns (rather than 10-year returns). He comes to the same conclusion that the E/P is significantly positively related to the real S&P 500 returns, while neither the 10-year treasury yield nor the E/P-Y variable are statistically significant. Again, this is in favor of the Traditional Model and against the Fed Model.
20:13 - Table 4. Forecasting 1-Year Real S&P 500 Returns
Next, the author performs the same regression over the 1881-2001, 1926-2001, 1955-2001, and 1982-2001 time periods, only this time the dependent variable is average rolling 20-year returns (rather than 10- or 20-year returns). In this study, the author generally finds that over the more recent periods (i.e., 1965- 2001 and 1982-2001) the E/P nor the Y or E/P-Y do a good job of explaining the real S&P 500 returns over the rolling 1-year periods; in fact, in all cases, the R^2 is less than 10%. There tend to be significant alphas during the more recent times, which means that something other than the traditional or fed models are explaining the 1-year returns; one would have had to know to be long equities over this period in order to capitalize on this alpha.
22:43 - Section 5. How P/Es and Real Rates Really Move Together
Next, the author creates a regression with the earnings yield (i.e., E/P) being the dependent variable and the 10-year treasury yield (i.e., Y) being the independent variable. If the Fed Model is appropriate, we should see the earnings yield move with the 10-year treasury yield. Instead, we get a regression that has a very low R^2 and the coefficient on Y is minuscule. This would mean that the 10-year treasury yield does not explain a significant portion of the variation in E/P over the time period; as such, there must be other variables that drive the E/P.
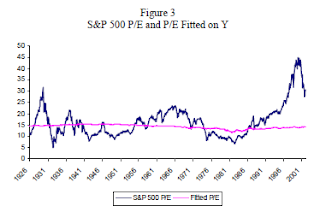
Plotting that regression against actual P/E over the years, we would get the following figure, where we see that the equation does a poor job of predicting P/E:
Next, the author adds the ratio of stock volatility to bond volatility as an independent variable. The thought process is that the E/P of the stock, should be equal to Y plus a risk premium (which might stem from the relative volatility of stocks to bonds). In adding the relative volatility variable, the R^2 jumps to 58.1% during the 1926-2001 period:
and to 78.9% during the 1955-2001 period:
As such, we see that the E/P figure has moved in an almost 1:1 ratio with the 10-year treasury when we also take into account the volatility of stocks relative to bonds. The following chart shows how well the new regression fits the actual P/Es over the 1926-2001 period:
The difference in results between the 1926-1965 and the 1965-2001 periods in the earlier figures and tables is due to relative volatility of stocks-to-bonds in recent years being stable, while the pre-1965 volatility ratio was less stable. This is why the Fed Model seemed to work in the post-1965 period; the volatility ratio piece did not have as much bearing on the results. As such, investors should consider the relative volatility of stocks to bonds in their assessment of the appropriate P/E ratio (and not just the level of the 10-year treasury yield).
28:34 - Section 6. The International Cross-Sectional Evidence
Finally, as a robust test, the author performs an out-of-sample test to verify the results we found above in the US market. The author forms the same regression of E/P (dependent variable) and Y (independent variable) across 10 developed countries over the 1987-2002 period. He finds a significant positive relationship between Y and E/P, with an R^2 of 32.2%; as such, countries with higher/lower interest rates tend to have higher/lower earnings yields.
Next, the author forms another regression of the stock market's real return (dependent variable) and E/P (independent variable); and another regression that add Y as a dependent variable. In doing so, the author hopes to learn how well do a country's stock earnings yield and interest rates explain the returns to the stock market. The traditional model would hold if the E/P is positive and significant while the Y is insignificant; and the Fed Model would hold if the E/P is positive and significant and the Y is negative and significant.
The results are that the E/P is significant and positive while the Y is insignificant. As such, the Traditional Model holds and the Fed Model fails. In summary, the real returns to the stock market are primarily driven by the the earnings yield at time of purchase, while the level of interest rates are inconsequential.


No comments:
Post a Comment