Quality companies tend to outperform junk companies, even after controlling for commonly used risk models.
To do that, the authors explore the persistence of quality in companies (i.e., does a company's quality today continue in the future). They sort the US and Global stocks according to their quality ranks (including the components of safety, growth, and profitability) today, then see how those stocks rank for quality 1, 3, 5, and 10 years into the future.
They find that companies ranked high (low) in quality today tend to have high (low) quality for all time periods in the future. As such, investors can possibly rely on the current quality of a company as a gauge for what its future quality might be.
To do so, they split the sample population into deciles according to their quality score ranks, and they find the alphas on t-bills, the CAPM model (controlling for market return), the 3-factor model (controlling for market return and value and size factors), and the 4-factor model (controlling for market return and value, size, and momentum factors). A higher alpha on these models would lead us to conclude that there are other variables (i.e., possibly quality factors) that are not explained by the variables controlled for in each of the models.
The authors find that as the quality rank of the companies increases, the alphas and excess returns also increase after controlling for the models' factors. The higher quality deciles also exhibit higher sharpe ratios, information ratios, and lower betas.
The authors find a significant alpha to the QMJ portfolios after controlling for t-bills, CAPM, 3-factor, and 4-factor models. These alphas come about because of the significantly negative relationship between the QMJ factor and the market (i.e., quality companies have lower market betas), size (i.e., quality companies tend to be larger), value (i.e., quality companies tend to be growth companies), and momentum (i.e., quality companies tend to have had a recent increase in price relative to lagging book value) factors. As such, quality seems to be a major component/contributor to the return of each of these commonly used factors.
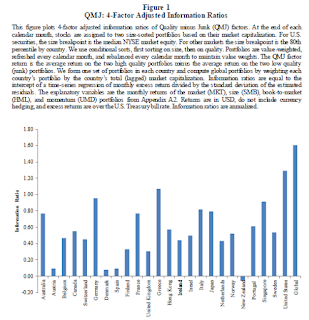
Out of all 24 countries under study, only 1 did not show a positive alpha on the 4-factor model (i.e., New Zealand, which represents the smallest market cap in the sample population). 17 of the 24 countries showed a statistically significant alpha. As such, the efficacy of the quality factor tends to be pervasive across several markets.
This figure shows the cumulative excess returns of the QMJ portfolios over t-bills. We see a consistently increasing and smooth accumulation.
This figure shows the cumulative alphas of the QMJ portfolios over the 4-factor model. We see a consistently increasing and smooth accumulation.
They find that analysts typically give a higher price-to-book ratio to higher quality companies (as they should); however, relative to the current price, they are giving a lower and lower expected return to higher quality companies, while the realized 1-year returns increase as quality increases. This presents the thought process that quality companies are currently underpriced (i.e., their current price-to-book ratio should be higher); if it were, the realized return would be more in line with analyst expectations. As such, this scenario might give investors an opportunity to capture a return to quality.
0:00 - Introduction
This paper is called "Quality Minus Junk", and it is written by Asness, Frazzini, and Pedersen. Prior academic research has shown that companies with higher quality characteristics (e.g., lower leverage, higher profitability, lower volatility, etc.) tend to outperform those with lower quality characteristics (i.e., "junk"). As such, the authors want to explore a new factor (i.e., Quality Minus Junk) in the same way that Fama-French did with their High Minus Low, Small Minus Big, etc. factors.0:44 - Table 1. Summary Statistics
The data under study includes equity securities across 24 developed markets (including the US market) over the 1957 - 2016 time period.1:13 - Table 2. Persistence of Quality Measures
The authors suggest that when making decisions, an investor should look to the future of the company in developing his valuations and executing his strategies. As such, the authors want to understand whether it is possible to predict the future quality of a company.To do that, the authors explore the persistence of quality in companies (i.e., does a company's quality today continue in the future). They sort the US and Global stocks according to their quality ranks (including the components of safety, growth, and profitability) today, then see how those stocks rank for quality 1, 3, 5, and 10 years into the future.
They find that companies ranked high (low) in quality today tend to have high (low) quality for all time periods in the future. As such, investors can possibly rely on the current quality of a company as a gauge for what its future quality might be.
3:24 - Table 3a. Cross Sectional Regressions, The Price of Quality
Next, the authors want to understand whether investors pay more for higher quality companies. To do that, they form 6 regressions on Market-to-Book ratios, with various combinations of independent variables to capture the drivers of the Market-to-Book ratios. In all regressions, they find that a company's quality score significantly explains the Market-to-Book ratio of the companies, on average, even after controlling for several other variables; the quality score explains about 10% of the variation in Market-to-Book ratios on its own.6:23 - Table 3b. Cross Sectional Regressions, The Price of Quality
For this table, the authors perform the same study as in Table 3a; only this time, they split the quality score into its components: Profitability, Growth, and Safety. They find that each of the components have merit on their own; and the overall quality score is not dominated by a single quality component.7:18 - Table 3c. Cross Sectional Regressions, The Price of Quality
Since prior studies have found that larger companies typically have higher quality, the authors want to understand how the price of quality is affected by company size. To do this, the authors form the same regression as in Tables 3a and 3b; however, this time, they split the sample population into deciles of company size. They find that the Market-to-Book ratios of larger companies (i.e., those in the higher deciles) tend to be more affected by quality scores than those of smaller companies (i.e., the coefficient on the quality factor is larger and more significant on larger companies).8:17 - Table 4. Quality Sorted Portfolios
Since in the prior tables we found that quality explains less than 50% of the variation in Market-to-Book ratios, the authors now want to see if there are other variables that explain the Market-to-Book ratios and whether those subsume the quality score's explanatory power.To do so, they split the sample population into deciles according to their quality score ranks, and they find the alphas on t-bills, the CAPM model (controlling for market return), the 3-factor model (controlling for market return and value and size factors), and the 4-factor model (controlling for market return and value, size, and momentum factors). A higher alpha on these models would lead us to conclude that there are other variables (i.e., possibly quality factors) that are not explained by the variables controlled for in each of the models.
The authors find that as the quality rank of the companies increases, the alphas and excess returns also increase after controlling for the models' factors. The higher quality deciles also exhibit higher sharpe ratios, information ratios, and lower betas.
12:02 - Table 5. Quality Minus Junk - Correlations
Next, for ease of study and presentation, the authors want to determine how correlated are the components of the quality score (i.e., profitability, safety, and growth) to each other and to the overall quality score. The authors find they are in fact highly correlated; therefore, the authors decide to scrap the individual components in the study (and only consider the overall quality score) which would ease the complexity of work on the authors and ease the presentation for their readers, without much affecting the conclusions of the study.14:26 - Table 6. Quality Minus Junk - Returns
Next, the authors want to explore a new factor: Quality Minus Junk (QMJ). They build portfolios in the same way that Fama-French did with their factors: they go long the top third and short the bottom third of stocks according to their quality score ranks (also splitting into small and large in order to give fair representation to small companies). This gives them an understanding of the returns that could be earned by investing in quality companies relative to junk companies.The authors find a significant alpha to the QMJ portfolios after controlling for t-bills, CAPM, 3-factor, and 4-factor models. These alphas come about because of the significantly negative relationship between the QMJ factor and the market (i.e., quality companies have lower market betas), size (i.e., quality companies tend to be larger), value (i.e., quality companies tend to be growth companies), and momentum (i.e., quality companies tend to have had a recent increase in price relative to lagging book value) factors. As such, quality seems to be a major component/contributor to the return of each of these commonly used factors.
Out of all 24 countries under study, only 1 did not show a positive alpha on the 4-factor model (i.e., New Zealand, which represents the smallest market cap in the sample population). 17 of the 24 countries showed a statistically significant alpha. As such, the efficacy of the quality factor tends to be pervasive across several markets.
17:48 - Figures 1-3. QMJ returns and alphas
This figure shows Table 6c (discussed above) in graphical form.This figure shows the cumulative excess returns of the QMJ portfolios over t-bills. We see a consistently increasing and smooth accumulation.
This figure shows the cumulative alphas of the QMJ portfolios over the 4-factor model. We see a consistently increasing and smooth accumulation.
19:09 - Table 7. 6-Factor Adjusted Returns
Next, the authors get into robustness checks. They perform the same study as table 6; only this time, they control for a 6-factor model (which adds the Conservative Minus Aggressive investment and Robust Minus Weak profitability) to the previous 4-factor model. They find that the RMW factor subsumes a lot of the quality factor (which makes sense, because a component of the quality factor is profitability); and even so, a significant alpha to the QMJ portfolios is still present.20:49 - Table 8. Returns During Different Regimes
Next, the authors want to understand what happens with QMJ returns in different regimes (e.g., expansions and recessions, bull and bear markets, high and low volatility, etc.). As would be expected, the QMJ portfolio performs better in bear markets than in bull markets; recessions than in expansions; and low volatility than high volatility.22:10 - Figure 6. The Price of Quality
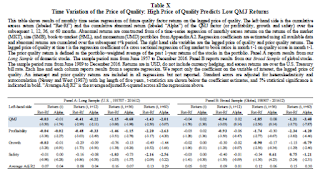
Next, the authors want to understand the price of quality (i.e., how does quality affect a company's market-to-book ratio) and how it has changed over time. They find that quality is more expensive (i.e., the market-to-book ratio increases more with increases to quality) during periods of market turmoil (such as the dot-com bubble and the housing collapse periods).23:51 - Table 9. Quality Sorted Portfolios - Target Prices
Next, the authors want to understand whether an investor can buy quality at times when it is cheap, and earn excess returns to quality. To do so, the authors sort the stocks into deciles of the quality scores and determine the price-to-book ratios, price target to book (by analysts), implied expected return, and realized 1-year return for each of the deciles.They find that analysts typically give a higher price-to-book ratio to higher quality companies (as they should); however, relative to the current price, they are giving a lower and lower expected return to higher quality companies, while the realized 1-year returns increase as quality increases. This presents the thought process that quality companies are currently underpriced (i.e., their current price-to-book ratio should be higher); if it were, the realized return would be more in line with analyst expectations. As such, this scenario might give investors an opportunity to capture a return to quality.


No comments:
Post a Comment