Showing posts with label Issue: Review of Quantitative Finance & Accounting. Show all posts

Sunday, June 16, 2019

The 52-week high, momentum, and predicting mutual fund returns. Sapp, T. (2011)

This is a summary of a paper written by Travis R.A. Sapp called "The 52-week high, momentum, and predicting mutual fund returns", published in 2011 in the Review of Quantitative Finance and Accounting journal.  A video summary can be found at the link below, or a narrative summary following the video link.

Table 1. Sample descriptive statistics

The authors are going to examine the results of using three different methods of momentum for mutual fund portfolios over the period 1970 - 2004: ranking by past 6 month returns (JT), momentum factor loading (Beta4), and nearness to the 52-week high (52-week).  


Table 2. Profits from momentum strategies: top and bottom 10%

The authors first rank the 3 methods using the top and bottom deciles, showing the long, short, and zero-cost returns.  They find that the JT and 52-week strategies provide significant excess returns; however, the Beta4 strategy's excess returns are not statistically different than zero.  The authors also analyzed these returns on a risk-basis, by putting the returns into the Fama-French 3-factor model and determining the alphas.  They find all three strategies have significant alphas.
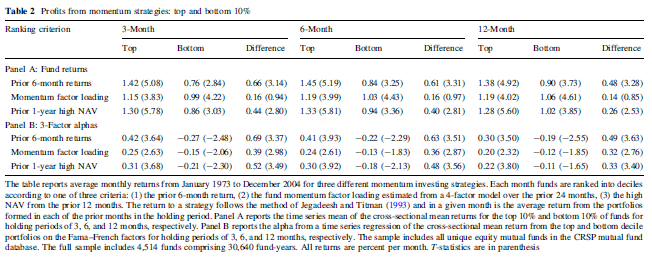


Table 3. Profits from momentum strategies: top and bottom 30%

Next, the authors perform the same analysis; but they rank the 3 methods with the top and bottom 30% of mutual funds (rather than the 10% in table 2).  They find the same conclusion noted in table 2; although, the excess returns are a bit dampened now that the less extreme cases are included.


Figure 1. One-Month Raw Returns

Next, the authors summarize graphically the returns of the 10% zero-cost portfolio and the 30% zero-cost portfolio over a 12-month period for each of the three ranking strategies.  It is clear that the JT and 52-week strategy have initial significant excess returns; however, those excess returns dissipate by the 12th month.  The Beta4 strategy has initially low excess returns; but those returns are consistent throughout the 12 months and end the year with the highest of the three strategies.


Figure 2. One-Month Alphas

Next, the authors summarize graphically the alphas of the 10% zero-cost portfolio and the 30% zero-cost portfolio over a 12-month period for each of the three ranking strategies.  Again we see the JT and 52-week strategy have initial significant excess returns; however, those excess returns dissipate by the 12th month, and the Beta4 strategy overtakes them.


Table 4. Comparison of momentum trading strategies

Next, the authors perform a Fama-MacBeth analysis of the three ranking strategies for the 10% and 30% zero-cost portfolios.  They find the same results as tables 1 and 2; whereby the JT and 52-week strategies provide significant excess raw returns; however, the beta4 strategy lags.  But all three strategies have statistically significant alphas over 3, 6, and 12 month time periods.


Figure 3. One-Month Hedged Alphas

Next, the authors take the results from table 4 and summarize them graphically over a 12 month period.  As was found in the prior figures, we see the JT and 52-week strategy have initial significant excess returns; however, those excess returns dissipate by the 12th month, and the Beta4 strategy overtakes them.


Figure 4. Long-Term One-Month Alphas

Next, the authors decided to extend their period of analysis out to a 24-month holding period.  They find that in the 13 to 24 month period, the JT and 52-week strategies continue to perform close to 0 hedged alphas, and the Beta4 strategy continues to outperform (although its hedged alpha slowly decreases over time).   As such, a long-term investor might prefer using the Beta4 strategy to capture more consistent excess returns than the JT and 52-week strategies (whose excess returns seem to be short-term and fleeting.


Table 5-7. Comparison of momentum strategies: no-load funds

Next, the authors isolate the no-load funds within their population, as a way to explore whether the three strategies can be profitable on a practical trading basis.  They explore the raw and risk-adjusted returns on the top/bottom deciles [Table 5], raw and risk-adjusted returns on the top/bottom 30% [Table 6], and hedged alphas on the top/bottom deciles and 30% [Table 7].  They find the same results as they found across all funds; therefore, these strategies could be implemented efficiently.


Table 8. Determinants of fund cash flows

Finally, the authors explore whether any of these three ranking strategies explain the cash flows into and out of a fund.  They find that the JT and 52-week strategies significantly explain cash flows into a fund, but the Beta4 strategy does not.  Other significant explanatory factors include total net assets, previous month's net cash flow, and expense ratio.


Sapp, T. (2011). The 52-week high, momentum, and predicting mutual fund returns. Review of Quantitative Finance & Accounting, 37(2), 149–179.

https://doi.org/10.1007/s11156-010-0199-7

George and Hwang (J Finance 59:2145-2176, ) have shown that the 52-week high share price carries significant predictive ability for individual stock returns, dominating other common momentum-based trading strategies. Based upon their results and other methods, this paper examines and compares the performance of three momentum trading strategies for mutual funds, including an analogous 1-year high measure for the net asset value of mutual fund shares. Strategies based on prior extreme returns and on fund exposure to stock return momentum are also examined. Results show that all three measures have significant, independent, predictive ability for fund returns. Further, each produces a distinctive pattern in momentum profits, whether measured in raw or risk-adjusted returns, with profits from momentum loading being the least transitory. Nearness to the 1-year high and recent extreme returns are significant predictors of fund monthly cash flows, whereas fund momentum loading is not.

Thursday, April 11, 2019

Capital Investment and Momentum Strategies. Jiang, G., Li, D., & Li, G. (2012)

The authors are attempting to determine how are momentum returns affected by different levels of capital investment within companies, on average.  They calculate capital investment in three different ways: the capital expenditures as a percentage of fixed assets, the change in capital expenditures from year to year, and the change in accruals (i.e., working capital) from year to year.

Their population includes United States publicly trades stocks during the period 1965 - 2004, and on average, firm's capital expenditures tend to be 14.6% of total capital assets, and their expenditures on capital assets and working capital do not significantly change year to year, on average.  These three measures of investment are also positively correlated with each other; but are not correlated with company size.

Next, the authors explored the momentum returns of this population to see what level of capital investment was made, on average, within different levels of momentum returns.  They sorted the population into portfolio quintiles of prior returns spanning 3 - 12 months, and recorded the returns of those portfolios over holding periods of 3 - 12 months.  Their results corroborate prior studies that find past winners outperform past winners in all formation and holding periods.  In relation to capital investment, they find that the past winners tend to have lower capital investment than past losers, and the level of capital investment tends to have a U-shape with the level of past returns.

Next, the authors isolate the formation/holding period of 6 months to form 5x5 sorts of level of momentum and level of capital investment.  They find that the best performing portfolio tends to have high momentum and high capital expenditure; and the worst performing portfolio tends to have low momentum and high capital expenditure.  The momentum returns tend to increase almost monotonically as the level of capital expenditure increases within the highest ranking momentum stocks, but decreases almost monotonically as the level of capital expenditure increases in the lower momentum rankings.  The momentum returns tend to exhibit a U-shape with increases in the other measures of capital investment (i.e., change in capital expenditures, and change in accruals).  However, the long-only returns of all portfolios (i.e., not the zero-cost portfolios, which are discussed above) tend to decrease as capital investment increases; the reason the higher capital investment portfolio does well for the zero-cost portfolio is because the high momentum returns decrease slower than the low momentum returns at each increase in capital investment.

Next, the authors look at the returns of the zero-cost portfolio within different subperiods within the 1965 - 2004 period.  Within all the subperiods, the momentum returns increase almost monotonically with each increase in capital expenditures.  Within all subperiods, the momentum returns exhibit a U-Shape with each increase in change in capital expenditure and change in accruals.

Next, the authors did a 10x3 sort, with 10 levels of momentum and 3 levels of capital investment; for the momentum, they also looked at different lengths of formation and holding periods from 3 - 12 months.  For the momentum returns, they calculated zero-cost portfolios as the top decile minus the bottom decile.  In line with their prior results, they find the momentum returns to increase monotonically with each increase in level of capital expenditure across all formation/holding periods.  In addition, they find the same U-shape of returns across changes in the change in capital expenditure and change in accruals.

Next, the authors formed a Fama French 3-factor regression (i.e., controlling the returns for market, size, and value returns) to explore the risk-adjusted returns for the portfolios.  They find similar results as the prior results, where the highest alpha portfolio is the one with the highest momentum and highest capital expenditure, and the lowest alpha portfolio is the one with the lowest momentum and highest capital expenditure.  The zero-cost alpha tends to increase as capital expenditures increase, and the portfolio alphas tend to decrease at each increase in capital expenditure.  When looking at the change in capital expenditure and change in accrual methods, we see a decrease in portfolio alphas as capital investment increases, but the zero-cost alphas exhibit a U-shape in line with the results of prior tables. 

Citation: Jiang, G., Li, D., & Li, G. (2012). Capital investment and momentum strategies. Review of Quantitative Finance & Accounting, 39(2), 165–188.

Link to paper: https://doi.org/10.1007/s11156-011-0250-3

Abstract: The main purpose of this paper is to investigate whether capital investment can affect stock price momentum. We provide empirical evidence that momentum strategies tend to be more profitable for stocks with large capital investment or investment changes. We present a simple explanation for our empirical results and show that our finding is consistent with the behavioral finance theory that characterizes investors' increased psychological bias and the more limited arbitrage opportunity when the estimation of firm value becomes more difficult or less accurate.